Third Quarter Strategic Income Outlook
Published on July 11, 2024
As we survey the economic landscape, we are reminded of Otis Redding’s classic hit, which is all about patience. “Looks like nothing’s gonna change, everything still remains the same.”
(Sittin’ On) The Dock of the Bay
In the summer of 1967, Otis Redding wrote his number-one single in Sausalito, just across the Golden Gate Bridge from our office. While the smash hit evokes a sense of loneliness, the main theme of the song is patience: sometimes it is best to stop and sit, observe, and wait. In last quarter’s outlook, we detailed how the prevailing expectations of recession, Fed cuts, and a selloff in risk assets have yet to come to fruition. At the end of the second quarter, we find ourselves in very much the same environment, and Otis Redding’s advice is as valuable today as it was when the song was released almost 60 years ago.
The Federal Reserve left the benchmark rate unchanged at 5.25-5.50% at its last meeting on June 11th. The meeting coincided with the release of the May CPI data, which had the market on edge for a potential 1-2 punch. Fortunately, the month-over-month change in CPI came in at 0.0%, which was its lowest reading since July 2022. Still, the Fed reduced the number of expected rate cuts in 2024 in its most recent dot plot. Granted, it is likely that the Fed made its decision on the dot plot before the May CPI figures were released, but it highlights again that the Fed will need to see at least several consecutive months of favorable inflation data before it lowers its benchmark rate. Despite the progress on the month-over-month change, the year-over-year change remained stubbornly above the Fed’s 2% target at 3.3%.
Jim Bianco at Arbor Research highlights the base effects on Core PCE (personal consumption expenditures) data that we feel are worth tracking and could factor into the Fed’s policy going forward. In short, we had four favorable inflation prints between May 2023 and August 2023. Those prints will now start rolling out of the year-over-year calculation and put upward pressure on annual inflation, unless they are replaced with similarly favorable data. This is akin to a golfer who has her four lowest scores about to roll out of her last twenty. Unless she matches those low scores, her handicap is likely to rise.
The interest rate market responded well to the benign CPI data, reversing the selloff that started at the beginning of the quarter. In the end, rates were largely unchanged across the curve, but the investment grade market posted a small positive quarterly return largely on spread tightening and carry. However, the total return for the Bloomberg U.S. Aggregate Bond Index was still negative for the first six months of the year. Risk assets, on the other hand, performed significantly better during the second quarter. The S&P 500 (+4.28%) and the Nasdaq (+8.47%) benefitted greatly from strong earnings and AI mania, particularly the mega cap technology companies at the top of the S&P 500. This type of concentrated outperformance among a few very large businesses typically raises concerns that equity markets may be heading towards the end of a cycle.
Our last few outlooks have felt somewhat repetitive, a bit like the song: “Looks like nothing’s gonna change, everything still remains the same.” Said another way, why are the markets so resilient in the face of higher fed funds rates, quantitative tightening, and an inverted yield curve? We feel that under the surface, there are forces at play that have almost completely offset the efforts of the Fed.
During the pandemic, in addition to slashing short rates, the Fed used quantitative easing (buying debt from the open market) as a tool to influence long-term rates and further ease monetary policy. Subsequently, in its effort to slow the economy and rein in inflation, it raised interest rates and engaged in quantitative tightening, where it let bonds on its balance sheet mature. In theory, this drains money from the system and creates headwinds for risk assets, but in reality it has been much less effective than expected.
In our last quarter’s outlook, we highlighted that the federal debt in the fourth quarter of 2023 grew at almost three times the rate of GDP due to huge fiscal stimulus packages passed by Congress. In other words, the federal government was borrowing heavily to spur growth at precisely the same time the Fed was engaging in quantitative tightening to cool the economy and tame inflation. As the chart below shows, the liquidity that was removed by quantitative tightening has been replaced almost 1:1 by the impact of higher federal borrowing.
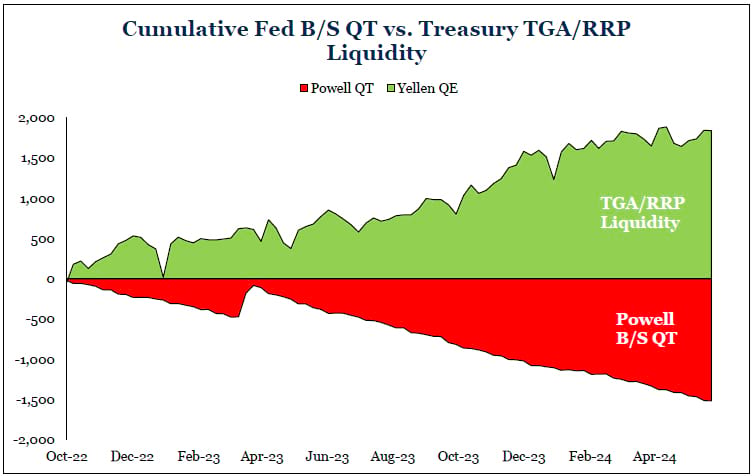
B/S = Balance Sheet, TGA = Treasury General Account, RRP = reverse repurchase agreement, QT = quantitative tightening
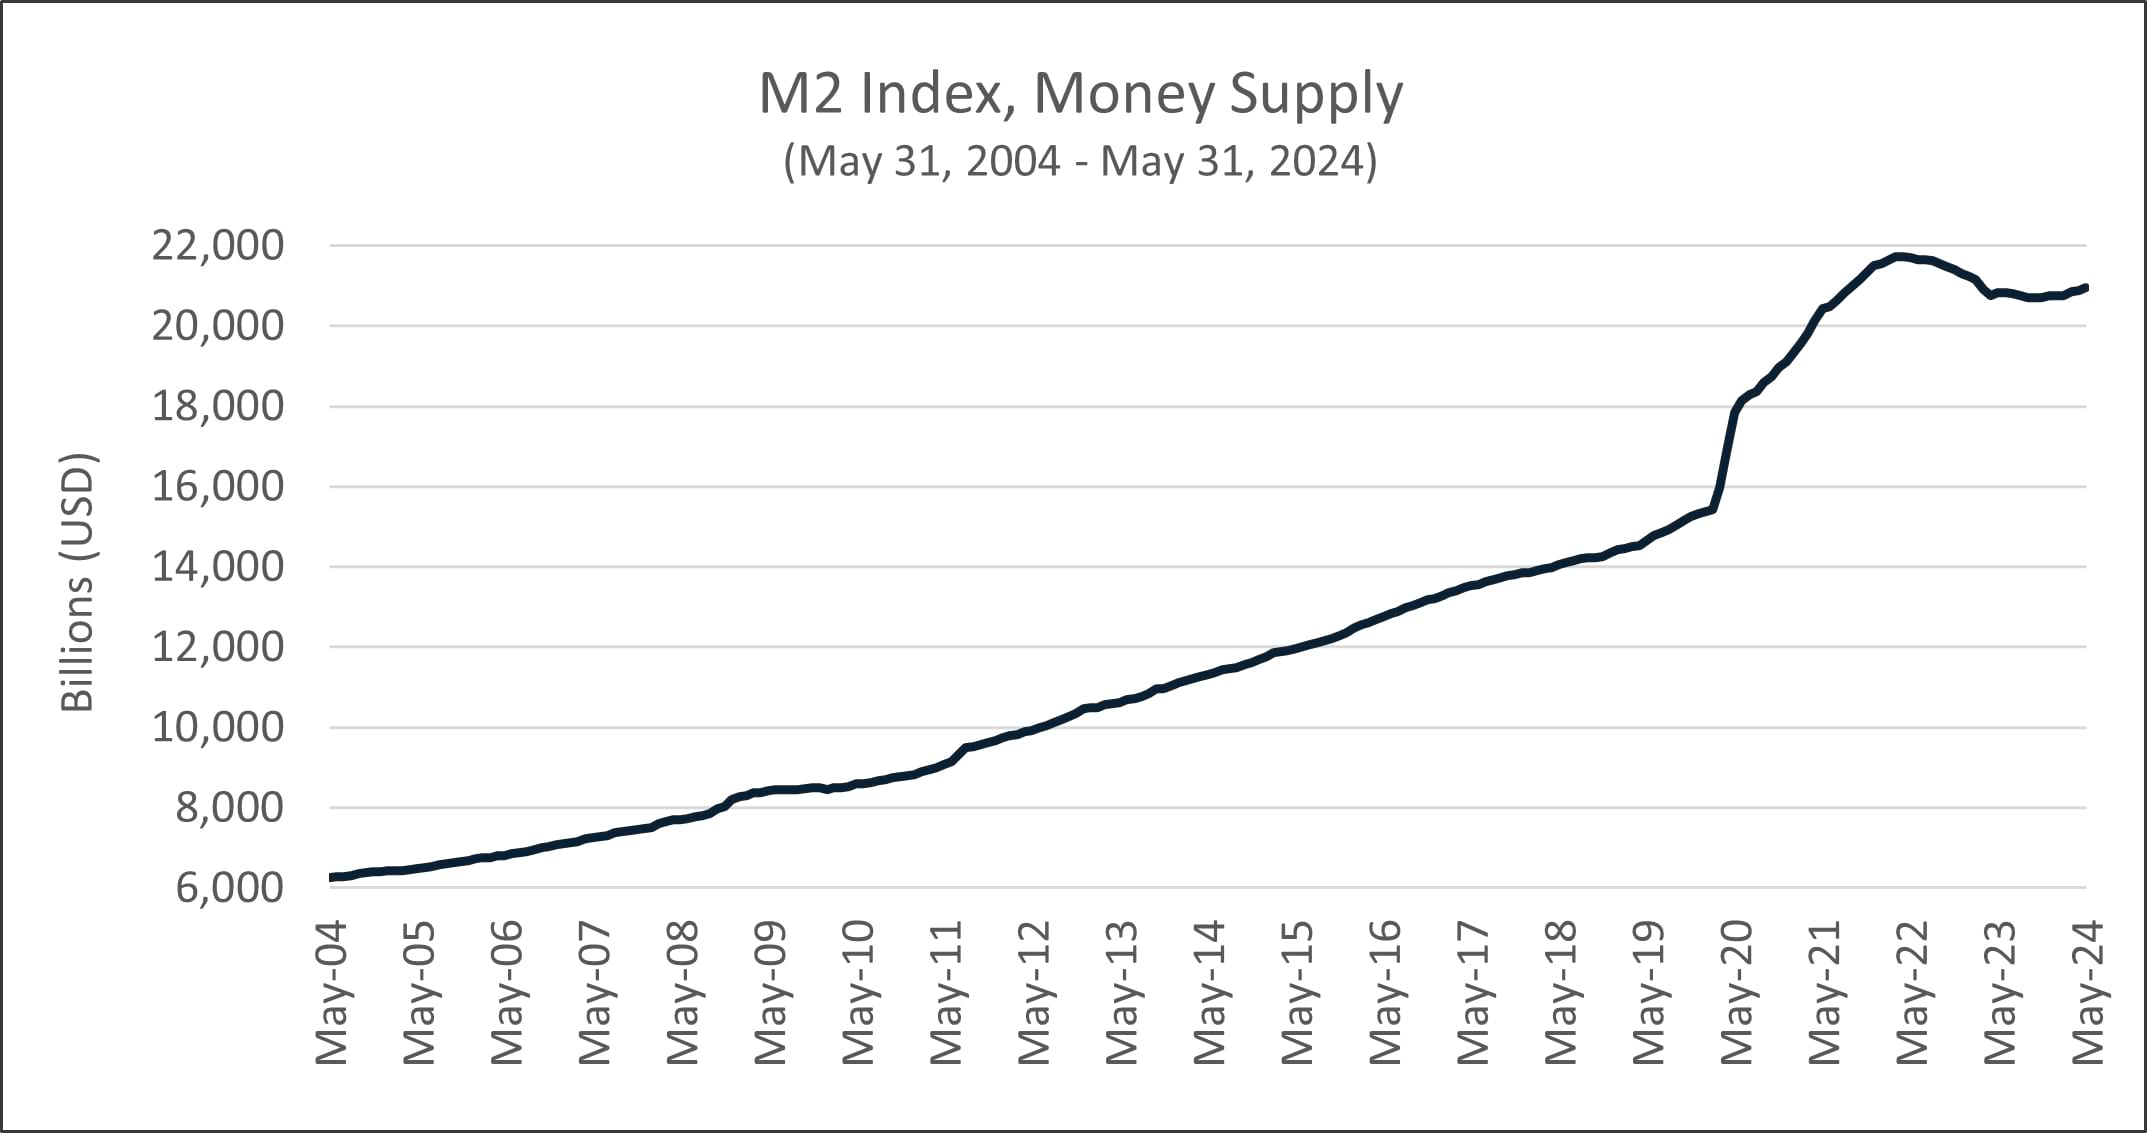
Before the days when the Fed held press conferences with granular transparency on its policy (and even when it changed the rate), the market would instead focus on the M2 money supply as an indicator of monetary conditions. The M2 money supply is higher on the year and only ~3.6% off its peak of 2022. This shows that the Fed’s efforts have not reduced the money supply and that the system remains awash in liquidity. As we all know, money abhors a vacuum and needs to find a home, which explains why risk assets have continued to do well.
We hope we are not succumbing to recency bias, but looking forward, we expect more of the same. Sticky inflation (i.e., Bianco’s base effects) should likely keep the Fed in its current wait-and-see mode, and when it finally decides to cut, history suggests it will likely act too late, not too early. Moreover, there is scant evidence that the Federal government will slow spending either before or after the election, as one of the few policies both parties agree on is large deficits – though one approaches it from the revenue side (lower taxes) and the other from the expense side (higher spending). In the meantime, we will continue to do what we have done historically: take what the market gives us, avoid making binary bets (including on Fed policy and elections), and invest in well-managed companies whose bonds offer attractive yields.
Like Otis Redding, we also suffer bouts of loneliness when we do not follow the herd. FOMO and oceans of liquidity often cause investors to stretch for yield and future returns. In markets like we have today, we find the value proposition for extending duration and/or going down the credit spectrum is not worth the additional risk. We feel there is more value at the short end of the curve given the extended period of inversion, and we also feel that longer maturities generally do not offer enough yield for the risk of a possible recession and spread widening.
For now, we will just sit on the dock and wait for the tide to roll in. As the song says, “I can’t do what ten people tell me to do, so I guess I’ll remain the same, yes.”
We thank you for your continued confidence in our management.
Carl Kaufman
Co-President, Co-Chief Executive Officer, Chief Investment Officer – Strategic Income & Managing Director – Fixed Income
Bradley Kane
Vice President & Portfolio Manager – Strategic Income
Craig Manchuck
Vice President & Portfolio Manager – Strategic Income
John Sheehan, CFA
Vice President & Portfolio Manager – Strategic Income
Featuring


Carl Kaufman
Co-President, Co-Chief Executive Officer, Chief Investment Officer – Strategic Income & Managing Director – Fixed Income
Carl Kaufman
Co-President, Co-Chief Executive Officer, Chief Investment Officer – Strategic Income & Managing Director – Fixed Income
Carl Kaufman serves in several key roles for the firm. He has managed the Osterweis Strategic Income Fund since its inception and serves as the Managing Director of Fixed Income, as well as a co-lead Portfolio Manager for the Osterweis Growth & Income Fund. Additionally, in his role as Co-President & Co-CEO he oversees key investment matters and is an integral part of the firm’s Management Committee.
He joined Osterweis Capital Management in 2002, after nearly 24 years at Robertson Stephens and Merrill Lynch.
Carl graduated from Harvard University and attended New York University Graduate School of Business Administration.
Outside his professional endeavors, he enjoys playing classical piano and actively contributes to the community as a member of the Board of Trustees for the San Francisco Conservatory of Music, supporting the arts and enhancing the cultural fabric of the SF Bay Area. Additionally, he enjoys playing golf, an activity that continually challenges his patience and precision.


Bradley Kane
Vice President & Portfolio Manager – Strategic Income
Bradley (Brad) Kane is a Portfolio Manager for the strategic income strategy and a partner at the firm. In his role he provides clients with a low-risk way to increase wealth, leveraging his extensive experience and deep understanding of the market.
Prior to joining Osterweis in 2013, Brad was a Portfolio Manager and Analyst at Newfleet Asset Management, where he managed both high yield and leveraged loan portfolios. Before that, he was a Vice President at GSC Partners, focusing on management of high yield and collateralized debt obligations. Earlier in his career, he managed high yield assets as a Vice President at Mitchell Hutchins Asset Management. In these positions he learned the importance of staying focused on one’s investing strategy and discovering new securities and investor types without succumbing to trends.
Brad graduated from Lehigh University with a B.S. in Business & Economics. Outside of his professional life, he enjoys playing golf, watching lacrosse and ice hockey, and indulging in his diverse taste in music, including a particular appreciation for heavy metal.


Craig Manchuck
Vice President & Portfolio Manager – Strategic Income
Craig Manchuck, a partner at Osterweis, is a Portfolio Manager for the strategic income strategy. In this role he enjoys investing clients’ assets in a common sense way that is designed to generate good risk-adjusted returns. Throughout his career, Craig has learned the importance of patience and that relationships with company management teams are invaluable.
Prior to joining Osterweis Capital Management in 2017, Craig was a Managing Director of Fixed Income Sales at Stifel Nicolaus, where he was responsible for sales and origination of high yield bonds, leveraged loans, and post reorg equities. Before Stifel, he held a similar role at Knight Capital. Before that, Craig was the Executive Director for Convertible Securities and then High Yield/Distressed Securities at UBS. He has previous experience in Convertible Securities Sales at Donaldson, Lufkin & Jenrette, SBC Warburg, and Merrill Lynch.
Craig graduated from Lehigh University with a B.S. in Finance and NYU Stern School of Business with an M.B.A. Outside of work, he enjoys golfing, wine, gardening, and spending time with family.


John Sheehan, CFA
Vice President & Portfolio Manager – Strategic Income
John Sheehan, a partner at Osterweis, is a Portfolio Manager for the strategic income strategy. In his role he appreciates the opportunity to contribute to clients feeling confident that their investments are positioned to meet their long-term goals. As a portfolio manager, he likes that the bond market is an ever-evolving game that blends art and science.
Prior to joining the Strategic Income team at the end of 2023, John was a portfolio manager for the total return strategy. Before that, he spent more than 20 years working at Citigroup, first as Managing Director responsible for Investment Grade Syndicate in New York City, where he advised issuers on accessing funding in the corporate bond market. Later at Citigroup, he was Managing Director in charge of West Coast Investment Grade Sales in San Francisco, where he covered several of the largest U.S. investment grade credit investors.
John graduated from Georgetown University with a B.A. in Economics. He holds the CFA designation and is a member of the CFA Society of San Francisco. Outside of work, John enjoys swimming and skiing with his family, as well as seeing live music.
Related Insight
For more information about this strategy, please send us an email or call us at (800) 700-3316.
The Fund was rated 4 Stars against 592 funds Overall, 4 Stars against 592 funds over 3 Years, 5 Stars against 538 funds over 5 Years, 4 Stars against 424 funds over 10 Years in the High Yield Bond category based on risk-adjusted returns as of 2/28/25.
The Morningstar Rating™ for funds, or “star rating,” is calculated for mutual funds, variable annuity and variable life subaccounts, exchange-traded funds, closed-end funds, and separate accounts) with at least a three-year history. Exchange-traded funds and open-ended mutual funds are considered a single population for comparative purposes. It is calculated based on a Morningstar Risk-Adjusted Return measure that accounts for variation in a managed product’s monthly excess performance, placing more emphasis on downward variations and rewarding consistent performance. The top 10% of products in each product category receive 5 stars, the next 22.5% receive 4 stars, the next 35% receive 3 stars, the next 22.5% receive 2 stars, and the bottom 10% receive 1 star. The Overall Morningstar Rating for a managed product is derived from a weighted average of the performance figures associated with its three-, five-, and 10-year (if applicable) Morningstar Rating metrics. The weights are: 100% three-year rating for 36-59 months of total returns, 60% five-year rating/40% three-year rating for 60-119 months of total returns, and 50% 10-year rating/30% five-year rating/20% three-year rating for 120 or more months of total returns. While the 10-year overall star rating formula seems to give the most weight to the 10-year period, the most recent three-year period has the greatest impact because it is included in all three rating periods.
© 2025 Morningstar. All Rights Reserved. The information contained herein: (1) is proprietary to Morningstar and/or its content providers; (2) may not be copied or distributed; and (3) is not warranted to be accurate, complete or timely. Neither Morningstar nor its content providers are responsible for any damages or losses arising from any use of this information. Past performance does not guarantee future results.The Osterweis Funds are available by prospectus only. The Funds’ investment objectives, risks, charges, and expenses must be considered carefully before investing. The summary and statutory prospectuses contain this and other important information about the Funds. You may obtain a summary or statutory prospectus by calling toll free at (866) 236-0050, or by visiting www.osterweis.com/statpro. Please read the prospectus carefully before investing to ensure the Fund is appropriate for your goals and risk tolerance.
Mutual fund investing involves risk. Principal loss is possible.
Past performance does not guarantee future results.
This commentary contains the current opinions of the authors as of the date above, which are subject to change at any time, are not guaranteed, and should not be considered investment advice. This commentary has been distributed for informational purposes only and is not a recommendation or offer of any particular security, strategy, or investment product. Information contained herein has been obtained from sources believed to be reliable but is not guaranteed.
No part of this article may be reproduced in any form, or referred to in any other publication, without the express written permission of Osterweis Capital Management.
Current and future holdings are subject to risk.
Yield is the income return on an investment, such as the interest or dividends received from holding a particular security. A yield curve is a graph that plots bond yields vs. maturities, at a set point in time, assuming the bonds have equal credit quality. In the U.S., the yield curve generally refers to that of Treasuries.
Spread is the difference in yield between a risk-free asset such as a Treasury bond and another security with the same maturity but of lesser quality.
The S&P 500 Index is widely regarded as the standard for measuring large cap U.S. stock market performance. The index does not incur expenses, is not available for investment, and includes the reinvestment of dividends.
The fed funds rate is the rate at which depository institutions (banks) lend their reserve balances to other banks on an overnight basis.
The Bloomberg U.S. Aggregate Bond Index (Agg) is widely regarded as the standard for measuring U.S. investment grade bond market performance. This index does not incur expenses and is not available for investment. The index includes reinvestment of dividends and/or interest income.
Source for any Bloomberg index is Bloomberg Index Services Limited. BLOOMBERG® is a trademark and service mark of Bloomberg Finance L.P. and its affiliates (collectively “Bloomberg”). Bloomberg owns all proprietary rights in the Bloomberg Indices. Bloomberg does not approve or endorse this material, or guarantees the accuracy or completeness of any information herein, or makes any warranty, express or implied, as to the results to be obtained therefrom and, to the maximum extent allowed by law, neither shall have any liability or responsibility for injury or damages arising in connection therewith.
The Nasdaq is an index that consists of the equities listed on the Nasdaq stock exchange. One cannot invest directly in an index.
Consumer Price Index (CPI) reflects the weighted average of prices of a basket of consumer goods and services, such as transportation, food, and medical care. There is typically a one-month lag in the measure due to the release schedule from the U.S. Bureau of Labor Statistics.
The Core PCE Deflator Index is defined as personal consumption expenditures (PCE) prices excluding food and energy prices.
Gross Domestic Product (GDP) is the monetary value of all the finished goods and services produced within a country’s borders in a specific time period.
The Treasury General Account (TGA) program provides services that accept cash and check deposits, including foreign items, from federal agencies.
A reverse repurchase agreement, also called a “reverse repo” or “RRP,” is a transaction in which the Federal Reserve sells a security to an eligible counterparty with an agreement to repurchase that same security at a specified price at a specific time in the future.
M2 is the U.S. Federal Reserve’s estimate of the total money supply, including all the cash people have on hand, plus all the money deposited in checking accounts, savings accounts, and other short-term saving vehicles such as certificates of deposit (CDs).
Osterweis Capital Management is the adviser to the Osterweis Funds, which are distributed by Quasar Distributors, LLC. [OCMI-568253-2024-07-03]
