Introduction
In our experience, small cap growth (SCG) funds are often treated as an afterthought rather than an essential component of an investor’s equity allocation. We strongly believe this is a missed opportunity, as SCG has historically been one of the highest returning sectors in the publicly traded markets. We created this guide to help investors familiarize themselves with the asset class and more effectively navigate the small cap growth market.
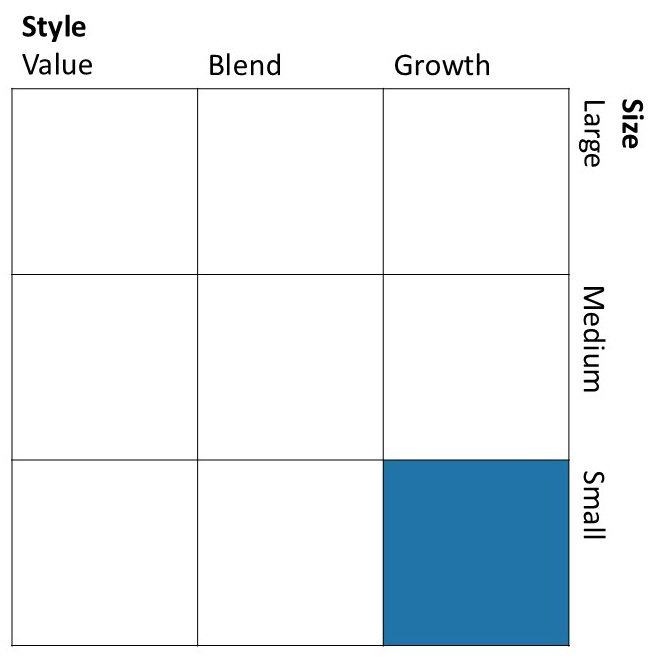
Perhaps the easiest way to conceptualize a small cap growth fund is to look at an equity style box, shown below. The x-axis spans the continuum from value to growth, while the y-axis shows size. In theory, the style box is a straightforward way to categorize the vast universe of publicly traded equities, but in practice the boundaries are blurry. In this primer, we attempt to provide the most common small cap growth definitions while also sharing our own perspective on the subtleties of the asset class.
What is a Small Cap Fund?
A quick internet search reveals that most sites define small cap stocks as companies with market capitalizations between $300 million and $2 billion. However, the majority of both passive and active small cap funds hold companies well in excess of that threshold.
For example, there are two major small cap indices in the United States: the Russell 2000 and the S&P 600. As of November 30, 2024, the weighted average market cap of the Russell 2000 was $4.0 billion, and the largest company was $17.3 billion. Likewise, the weighted average of the S&P 600 was $3.8 billion and the largest company was $9.7 billion. Most actively managed small cap funds invest in the constituents of the small cap indices, so they also regularly own companies larger than $2 billion.
Given that the $2 billion threshold is largely theoretical, we recommend looking at a fund’s benchmark and its holdings, rather than its average market cap, to determine if it is investing in small caps. Whether it is active or passive, as long as it is tracking a reputable small cap index, it should be providing access to the small cap portion of the market.
What is a Growth Fund?
A growth fund is made up primarily of growth stocks, which are shares of companies that are expected to grow faster than the market. However, there is no standard, quantifiable definition of “growth” because there are so many different metrics one can use to evaluate a company’s potential. As a result, each index, as well as each fund manager, uses their own methodology.
The Russell 2000 Growth Index, which is the growth subset of the Russell 2000, uses a fairly complex methodology, focusing on stocks with “relatively higher price-to-book ratios” and “higher sales per share historical growth (5 years)” as well as companies with “higher” two-year growth forecasts in the Institutional Brokers' Estimate System. Meanwhile, the S&P 600 Growth Index considers just three factors: “sales growth, the ratio of earnings change to price, and momentum.”
The two indexes clearly define growth differently, so it is not surprising that managers do, too. In our case, we tend to focus on top-line revenue growth — generally we look for companies that have grown at least 20% over the past few quarters. We also look at a variety of other metrics, including margin growth rates and valuation ratios.
Managers also have different views about profitability. Some are willing to buy fast-growing companies that are losing money, as long as the top line growth is robust and consistent. Others require at least some profitability before they will invest. In our fund, we strongly prefer profitable companies but will occasionally deviate when we feel the fundamentals make sense.
Are There Different Types of Growth?
Generally speaking, investors divide “growth” into two categories: cyclical vs. secular. Cyclical growth tends to be highly correlated with the health of the macro economy — an obvious example is the travel industry. When people are employed and have disposable income, they tend to spend more on vacation and vice-versa. Secular growth, on the other hand, is driven by structural changes in demand. eCommerce is a good example — once consumers began to adjust to the idea of shopping online, its popularity grew steadily regardless of the macro conditions.
In our view, companies that are driven by secular growth are generally much better investments than cyclical growers. We will occasionally take positions in cyclical companies, but our basic view is that companies benefitting from secular tailwinds tend to be innovators that are proactively creating expanding markets for themselves.
Returning to the eCommerce example, think of all the ways Amazon.com has evolved over the years to make online shopping easier and thus more ubiquitous. It has not passively benefitted from changes in customer preferences. Rather, it has continually expanded its services to meet the needs of its users, which has significantly increased the number of people who shop online.
When evaluating small cap growth funds, we recommend focusing on managers who prioritize secular growth. Cyclical growth can be a nice supplement to a portfolio, particularly when the economy is doing well, but generally the best performing companies are those that tap into durable secular trends. Click here to learn more about why we believe secular growth is so important to an investment portfolio.
What is the Composition of the SCG Universe?
The small cap growth universe is concentrated in the following sectors: Health Care, Industrials, Information Technology, Consumer Discretionary, and Financials. As of December 31, 2024, the first three sectors in this list made up over two-thirds of the Russell 2000 Growth Index, and collectively, those five sectors accounted for 85% of the index.
The sector weightings of the index tend to be fairly stable, and not surprisingly, each of the top three are areas of the economy where innovation (i.e., secular growth) is the norm. Health care, for example, is constantly improving itself. When a new medicine or technological approach breaks through, adoption can be quite rapid, resulting in strong, sustained revenue growth. Likewise, disruptive industrial and information technology businesses often experience strong secular growth once their products begin to take market share from incumbents.
Small cap growth companies also tend to be younger businesses, although there are exceptions. Many have entered the market through an initial public offering (IPO) within the past few years, but, as we have previously written, we think it makes sense to wait several months after an IPO before investing in a new public company. The IPO pipeline is very important to the small cap universe because the best-performing small stocks inevitably graduate to a larger index, so it is essential that new, promising companies continue to emerge.
What Are the Risks of Small Cap Growth Funds?
In finance, as in life, there are no free lunches, and in exchange for the opportunity to achieve higher returns, small cap growth stocks have historically been more volatile than large caps. (This makes sense, as investors typically demand more return for riskier assets.)
As you can see from the chart below, after losing more than the S&P 500 in the 2002, 2008, and 2018 selloffs, the Russell 2000 Growth Index cumulatively outperformed in the subsequent two-year periods. This is what we would expect from small cap growth stocks — more downside in bear markets with the potential for faster growth during the recovery periods. Note that this pattern did not recur following the 2022 selloff, as the extended AI rally disproportionately benefitted the megacap technology companies in the S&P 500.
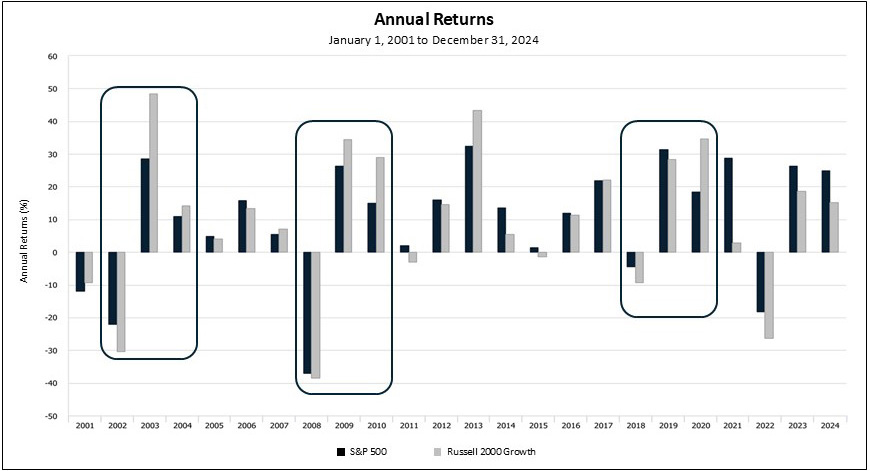
Source: eVestment
Taking a more quantitative view, the table below contains the historical risk/return characteristics of the Russell 2000 Growth Index vs. the other small cap indexes and the S&P 500. As expected, for the past 20 years, the returns of the small cap growth index have exceeded that of both the overall small cap index and the small cap value index, though they have slightly lagged the S&P 500’s return. Also as expected, the small cap growth volatility, as measured by standard deviation, has been slightly higher than both the other small cap indexes and the S&P 500.

Source: eVestment, 20-year period ending 12/31/24.
Interestingly, if we exclude the post-pandemic years, which featured a rare combination of surging inflation and higher rates, both of which are particularly bad for smaller companies, the small cap growth index outperformed the other small cap indexes and the S&P 500.
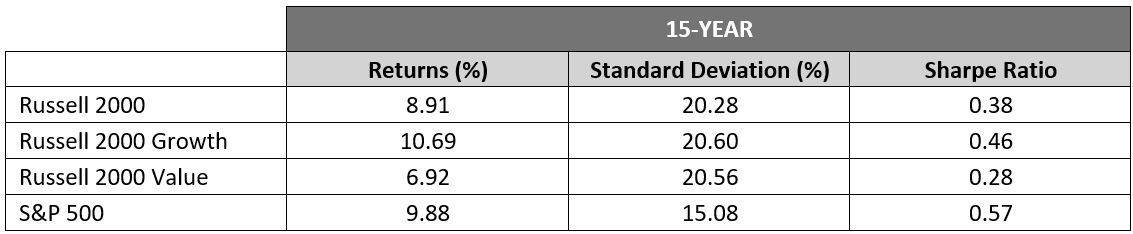
Source: eVestment, 15-year period ending 12/31/20.
Does Active Management Work Better for Small Caps?
Although passive investing has become a progressively larger share of the mutual fund/ETF landscape over the past few decades, a recent study by Morgan Stanley suggests that may be the wrong approach for small cap investors.
As the chart below shows, over the last 30 years, the cumulative median alpha generated by an active manager in U.S. small caps has been almost 60%. On the other hand, the cumulative median alpha has been negative for U.S. mid (-14%) and large cap (-17%) active managers.
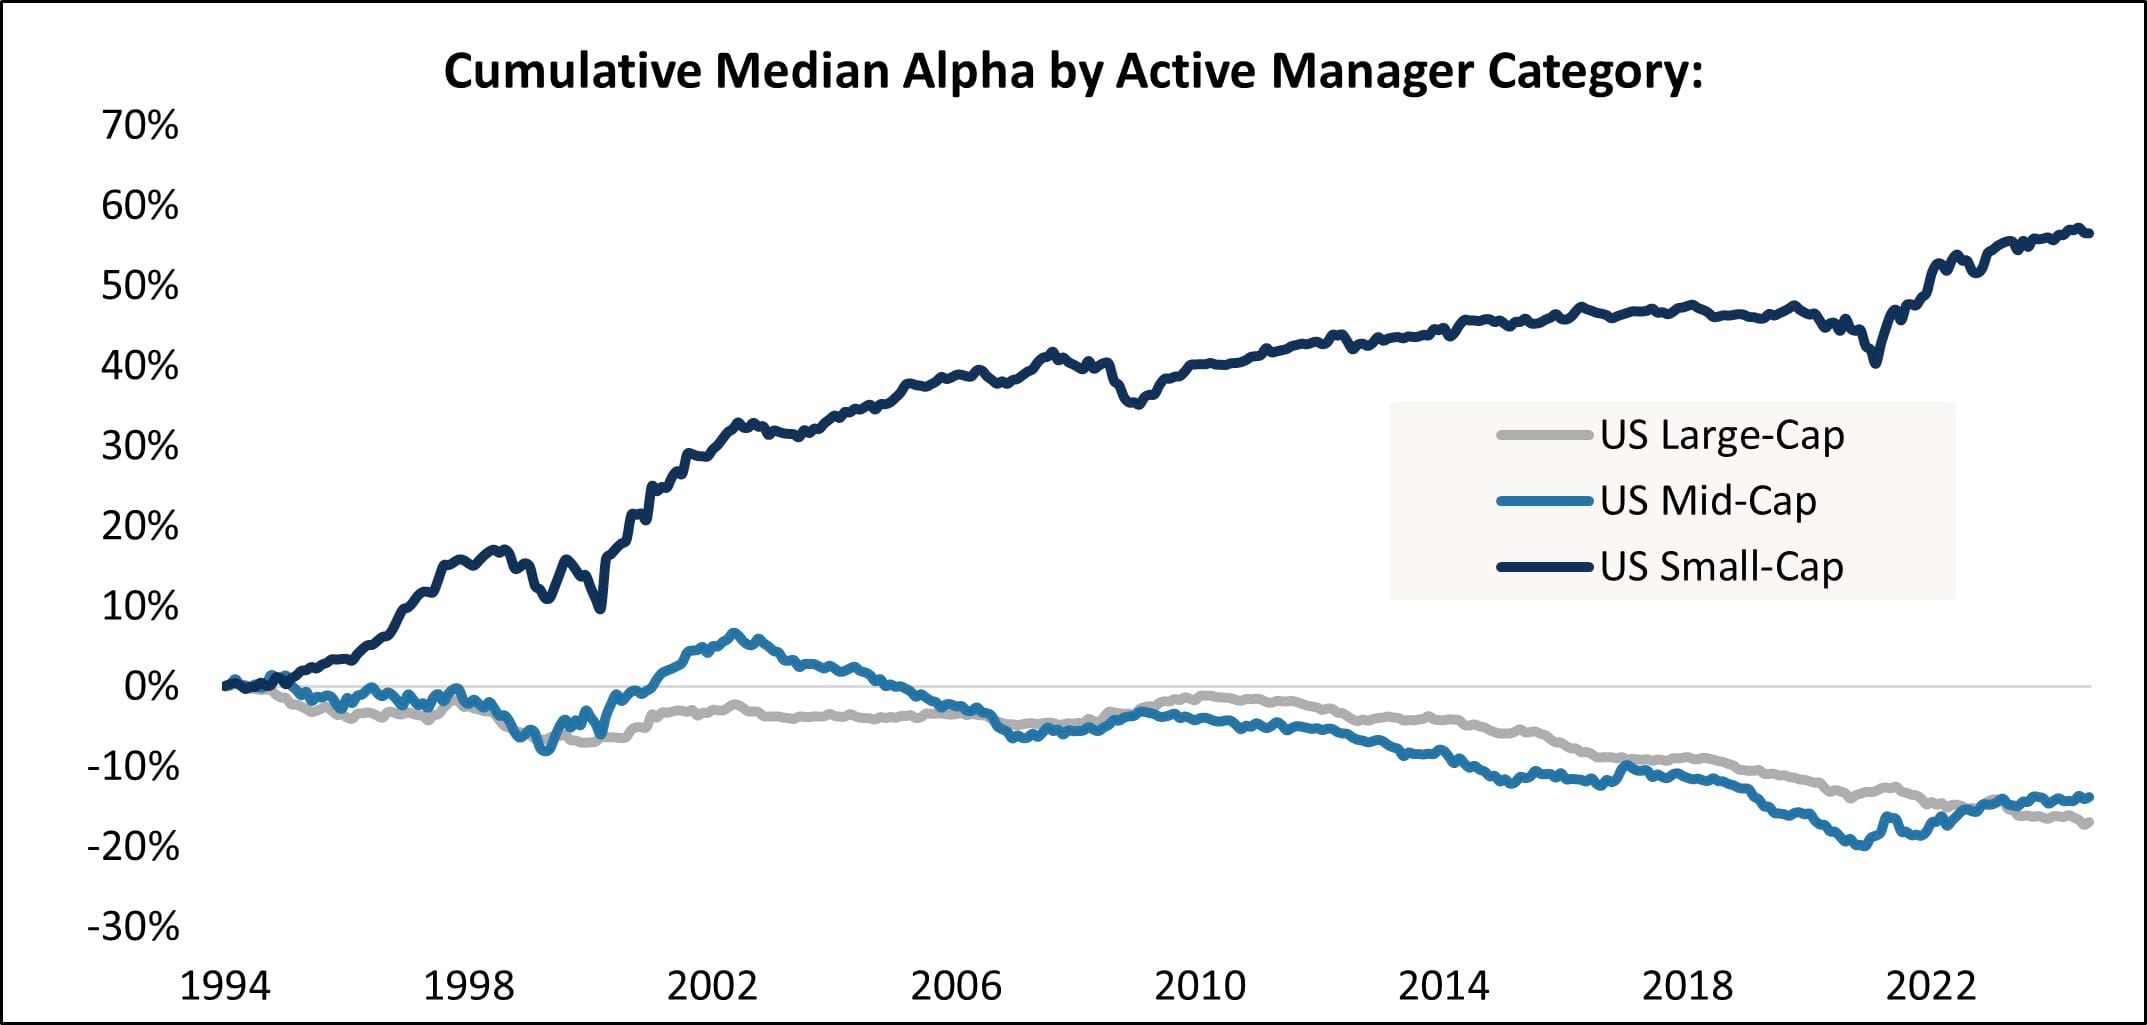
Source: Morningstar, Morgan Stanley Wealth Management Global Investment Office. Data through 8/31/2024. Past performance does not guarantee future results. See disclosures for standardized performance.
As we have previously written, we believe that there are several reasons small cap managers continue to add more alpha than other active managers do. Most importantly, the small cap universe contains the highest concentration of mispriced companies in the public markets, as it has comparatively less analyst coverage and more companies with shorter track records. Thus, managers with strong due diligence practices and a disciplined buy/sell approach can find promising companies before they become widely known and exit when valuations are no longer attractive. This has been consistent with our own experience, as we have been able to outperform the Russell 2000 Growth Index since our inception.
What is the Role of Small Cap Growth in a Portfolio?
In our view, small cap growth is a strategically important asset class that belongs in most equity portfolios. The diversification benefits of holding small cap stocks alongside large and mid cap stocks are well established. Combining securities that are not perfectly correlated generally reduces portfolio volatility, as price movements tend to offset one another, particularly over the long term.
While investors must determine their specific allocations based on risk tolerance and investment objectives, we believe a market-weighted portfolio is a sensible starting point. In other words, investors should consider holding each asset class roughly in proportion to its representation in the broader market.
Still, this leaves the question of investing in small caps generally versus small cap growth or small cap value. We strongly believe that small cap growth is the most appropriate choice for investors seeking small cap exposure.
For us, the logic is straightforward. Most investors rely on their equity portfolios to generate the bulk of their long-term returns. Therefore, investing a small portion of your portfolio in young, innovative companies with the potential to outperform the market seems like a natural approach, particularly for individuals with multi-year investment horizons. In our view, excluding small cap growth from an equity allocation is a little like voluntarily driving below the speed limit.
As we mentioned earlier, small cap growth does not always outperform large cap stocks, but there have been extended periods where it has. The chart below shows that the Russell 2000 Growth outperformed the S&P 500 from 2003 to 2021.
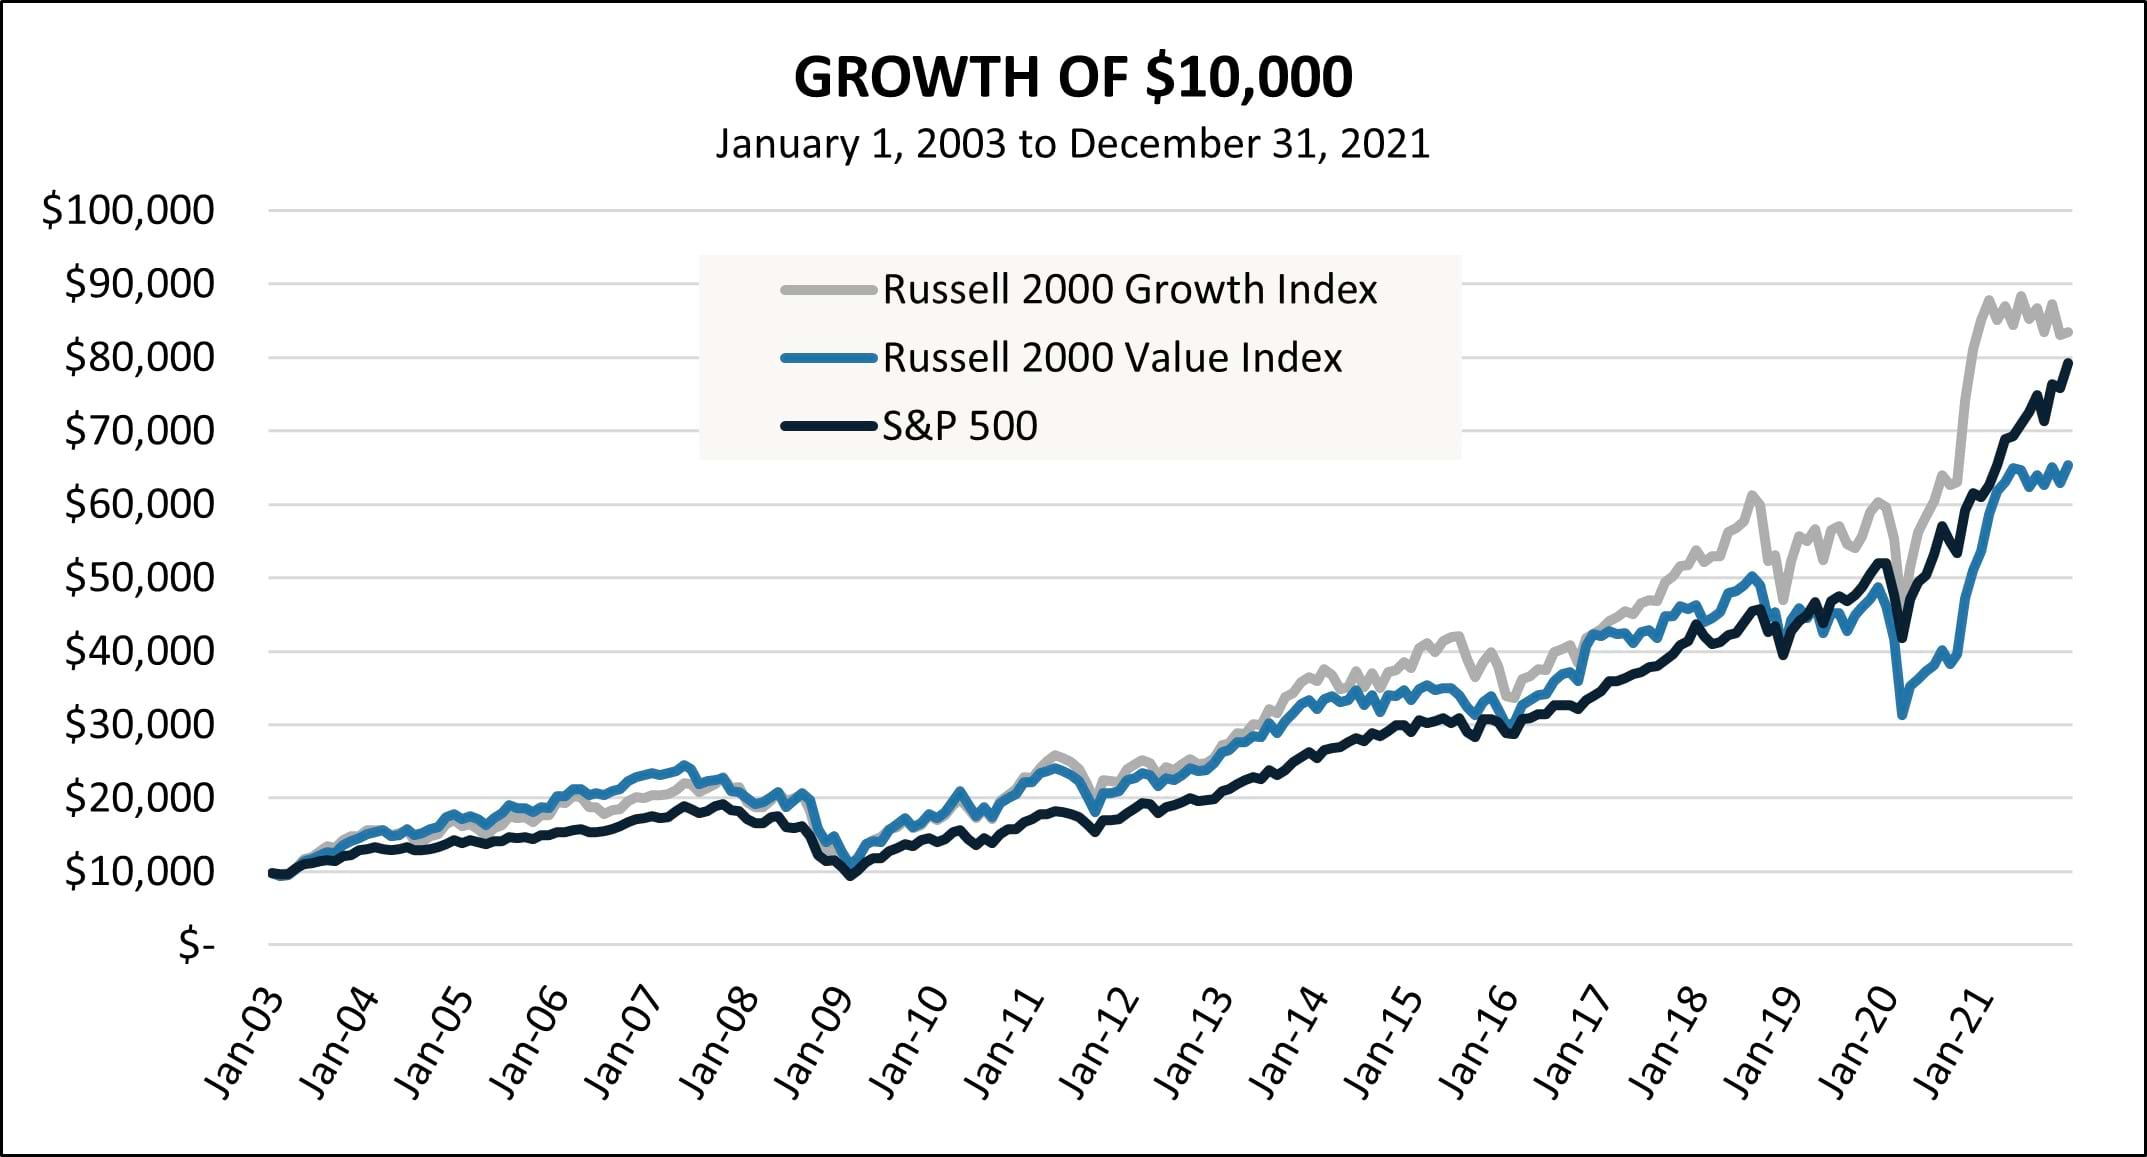
Source: Rimes
Final Thoughts
Although small cap growth may not be a focus for investors, we believe it is an important asset class for equity allocations. Beyond the academic arguments about diversification, the small cap growth universe contains a disproportionately high concentration of the fastest growing companies in the public markets, which should increase the odds of generating above-market returns.
Moreover, savvy portfolio managers can select high-quality companies within that fast-growing ecosystem, which allows them to generate even stronger returns. Some of the biggest companies in the world began as small caps, and owning just a few of those kinds of stocks can materially boost returns over a long time horizon.
Featuring


James Callinan, CFA
Co-CIO – Small Cap Growth & Portfolio Manager
Jim Callinan, a partner at Osterweis, is a Portfolio Manager for the small cap growth strategy. Throughout his career he has focused on investing in companies that are early in their growth cycles. This experience has been the foundation of our high conviction, valuation-aware approach to investing in small cap growth companies.
Prior to Osterweis, Jim was the Co-Founder & Chief Investment Officer at RS Investments. He also founded the RS Growth Group LLC in 1996 and managed the RS Emerging Growth Fund from 1996 until 2010. In 1999 Jim was named Morningstar’s Domestic Stock Manager of the Year.*
Jim served as portfolio manager for the Putnam OTC Emerging Growth Fund from 1994 to 1996 and began his career at Putnam Investments as an equity research analyst in 1987. He joined Osterweis in 2016 and brought with him the Emerging Growth Partners, LP, a concentrated small cap growth strategy he founded at RS in 2006.
Jim graduated from Harvard College with a B.A. in Economics, New York University with an M.S. in Accounting, and Harvard Business School with an M.B.A. He holds the CFA designation and is a member of the Weatherbie Capital Advisory Board. Outside of work, Jim enjoys spending time with his family, travelling, and golfing.
*Morningstar Managers of the Year are determined by a combination of qualitative research by Morningstar’s manager research analysts; risk-adjusted medium- to long-term performance track records; and performance in the calendar year.


Bryan Wong, CFA
Co-CIO – Small Cap Growth & Portfolio Manager
Bryan Wong, a partner at Osterweis, is a Portfolio Manager for the small cap growth strategy. He is passionate about identifying overlooked opportunities with the potential to deliver strong, sustainable performance, helping clients achieve their long-term investment objectives. Bryan particularly enjoys investing in small companies, where the dynamic nature of the market provides fundamental investors the ability to gain a distinct edge through rigorous research and analysis.
Prior to joining Osterweis Capital Management in 2014, Bryan was a member of the investment team managing the endowment of the David and Lucile Packard Foundation. Before that, he was an Analyst at Wohl Capital Management, a long/short hedge fund.
Bryan graduated from Yale University with a B.A. in Political Science and International Studies with distinction and from the University of California Berkeley, Haas School of Business, with an M.B.A., where he was an Investment Management Fellow. He holds the CFA designation and is a member of the CFA Society of San Francisco. Bryan also serves on the investment committee of the Asian Pacific Fund. Outside of work, he enjoys spending time with family and swimming.


Matt Unger, CFA
Vice President, Portfolio Manager & Director of Research – Small Cap Growth
Matt Unger, CFA
Vice President, Portfolio Manager & Director of Research – Small Cap Growth
Matt Unger, a partner at Osterweis, is a Portfolio Manager for the small cap growth strategy. He enjoys identifying investments in small cap growth companies, particularly those in the Health Care and Industrials sectors.
Prior to joining Osterweis Capital Management in 2016, Matt was a Research Associate at RS Investments, covering small cap growth companies in the medical technology and industrial sectors. Before graduate school, he worked at Platte River Capital covering the medical device sector.
Matt graduated from Trinity University with a B.S. in Finance, cum laude and Southern Methodist University, Cox School of Business with an M.B.A. He holds the CFA designation. Outside of work, Matt enjoys golfing and traveling.
For more information about this strategy, please send us an email or call us at (800) 700-3316.
Related Insights
Opportunity Fund Quarter-End Performance (as of 3/31/26)
| Fund | 1 MO | QTD | YTD | 1 YR | 3 YR | 5 YR | 10 YR |
INCEP (10/1/2012) |
|---|---|---|---|---|---|---|---|---|
| OSTGX | -6.59% | -3.78% | -3.78% | 13.34% | 10.02% | 0.53% | 13.56% | 12.79% |
| Russell 2000 Growth Index | -6.30% | -2.81% | -2.81% | 23.58% | 12.27% | 1.62% | 9.79% | 10.01% |
Gross/Net expense ratio as of 3/31/25: 1.19% / 1.12%. The Adviser has contractually agreed to waive certain fees through June 30, 2026. The net expense ratio is applicable to investors.
Performance data quoted represent past performance; past performance does not guarantee future results. The investment return and principal value of an investment will fluctuate so that an investor’s shares, when redeemed, may be worth more or less than their original cost. Current performance of the Fund may be higher or lower than the performance quoted. Performance data current to the most recent month end may be obtained by calling shareholder services toll free at (866) 236-0050. Performance prior to December 1, 2016 is that of another investment vehicle (the “Predecessor Fund”) before the commencement of the Fund’s operations. The Predecessor Fund was converted into the Fund on November 30, 2016. The Predecessor Fund’s performance shown includes the deduction of the Predecessor Fund’s actual operating expenses. In addition, the Predecessor Fund’s performance shown has been recalculated using the management fee that applies to the Fund, which has the effect of reducing the Predecessor Fund’s performance. The Predecessor Fund was not a registered mutual fund and so was not subject to the same operating expenses or investment and tax restrictions as the Fund. If it had been, the Predecessor Fund’s performance may have been lower.
Rates of return for periods greater than one year are annualized.
Where applicable, charts illustrating the performance of a hypothetical $10,000 investment made at a Fund’s inception assume the reinvestment of dividends and capital gains, but do not reflect the effect of any applicable sales charge or redemption fees. Such charts do not imply any future performance.
The Russell 2000 Growth Index (Russell 2000G) is a market-capitalization-weighted index representing the small cap growth segment of U.S. equities. This index does not incur expenses and is not available for investment. This index includes reinvestment of dividends and/or interest.
References to specific companies, market sectors, or investment themes herein do not constitute recommendations to buy or sell any particular securities.
There can be no assurance that any specific security, strategy, or product referenced directly or indirectly in this commentary will be profitable in the future or suitable for your financial circumstances. Due to various factors, including changes to market conditions and/or applicable laws, this content may no longer reflect our current advice or opinion. You should not assume any discussion or information contained herein serves as the receipt of, or as a substitute for, personalized investment advice from Osterweis Capital Management.
Complete holdings of all Osterweis mutual funds (“Funds”) are generally available ten business days following quarter end. Holdings and sector allocations may change at any time due to ongoing portfolio management. Fund holdings as of the most recent quarter end are available here: Opportunity Fund
As of 12/31/2024, the Osterweis Opportunity Fund did not own Amazon.com.
Mutual fund investing involves risk. Principal loss is possible. The Osterweis Opportunity Fund may invest in unseasoned companies, which involve additional risks such as abrupt or erratic price movements. The Fund may invest in small and mid-sized companies, which may involve greater volatility than large-sized companies. The Fund may invest in IPOs and unseasoned companies that are in the early stages of their development and may pose more risk compared to more established companies. The Fund may invest in ETFs, which involve risks that do not apply to conventional funds. Higher turnover rates may result in increased transaction costs, which could impact performance. From time to time, the Fund may have concentrated positions in one or more sectors subjecting the Fund to sector emphasis risk. The Fund may invest in foreign and emerging market securities, which involve greater volatility and political, economic and currency risks and differences in accounting methods. These risks may increase for emerging markets.
The Osterweis Funds are available by prospectus only. The Funds’ investment objectives, risks, charges, and expenses must be considered carefully before investing. The summary and statutory prospectuses contain this and other important information about the Funds. You may obtain a summary or statutory prospectus by calling toll free at (866) 236-0050, or by visiting www.osterweis.com/statpro. Please read the prospectus carefully before investing to ensure the Fund is appropriate for your goals and risk tolerance.
Diversification does not assure a profit, nor does it protect against a loss in a declining market.
Jensen’s Alpha is a measure of the difference between the portfolio’s actual return versus its expected performance, given its level of risk as measured by Beta. It is a measure of the historical movement of a portfolio’s performance not explained by movements of the market. It is also referred to as a portfolio’s non-systematic return.
Market capitalization (aka market cap) is the total market value of a security’s outstanding shares.
The S&P 600 is an index of small-cap stocks managed by S&P.
The S&P 600 Growth measures constituents from the S&P 600 that are classified as growth stocks.
The S&P 500 Index is widely regarded as the standard for measuring large cap U.S. stock market performance. The index does not incur expenses, is not available for investment, and includes the reinvestment of dividends.
The Russell 2000 Index is a stock market index that measures the performance of the 2,000 smaller companies included in the Russell 3000 Index.
The Russell 2000 Value Index measures constituents from the Russell 2000 that are classified as value stocks.
These indices do not incur expenses (unless otherwise noted) and are not available for investment.
Price-to-Book (P/B) Ratio is the ratio of a company’s stock price to its book value per share.
The Sharpe ratio is the difference between the annualized portfolio return and the annualized risk-free return, divided by the annualized standard deviation of the portfolio returns. It represents the additional amount of return that an investor receives per unit of increase in risk.
Standard deviation (annualized): This measure of dispersion represents the degree to which an investment’s returns vary around a mean. The greater the standard deviation, the more volatile an investment’s returns were during the period measured.
Osterweis Capital Management is the adviser to the Osterweis Funds, which are distributed by Quasar Distributors, LLC. [OCMI-681872-2025-02-03]
