2019 has been a rough year for the venture capital industry. Multiple high profile IPOs have either fared poorly (e.g., Uber, Lyft, Slack, Peloton) or been postponed (e.g., WeWork), tarnishing the industry’s reputation and triggering a wave of negative press.
Lost amidst the headlines is the significant fact that over 80 venture backed firms have gone public already this year, and another 134 went public last year1. These totals indicate that the VC industry is thriving, which is good news for managers like us. Not only does the creation of new public firms expand our investible universe, but more importantly, VC-backed emerging firms generally exploit the types of secular growth trends that we believe are the true drivers of both revenue growth and returns.
Venture Capital Has Evolved
The venture capital industry has been growing steadily for the past decade and is now a powerful economic force. Venture backed firms impact society in a variety of profound ways, whether or not they’re public. Ridesharing giants Uber and Lyft began transforming how people get around long before their recent IPOs. Likewise, AirBnB has fundamentally changed how people travel, even though it’s still private. And Beyond Meat is having a similar impact on how consumers think about hamburgers and other meat products.
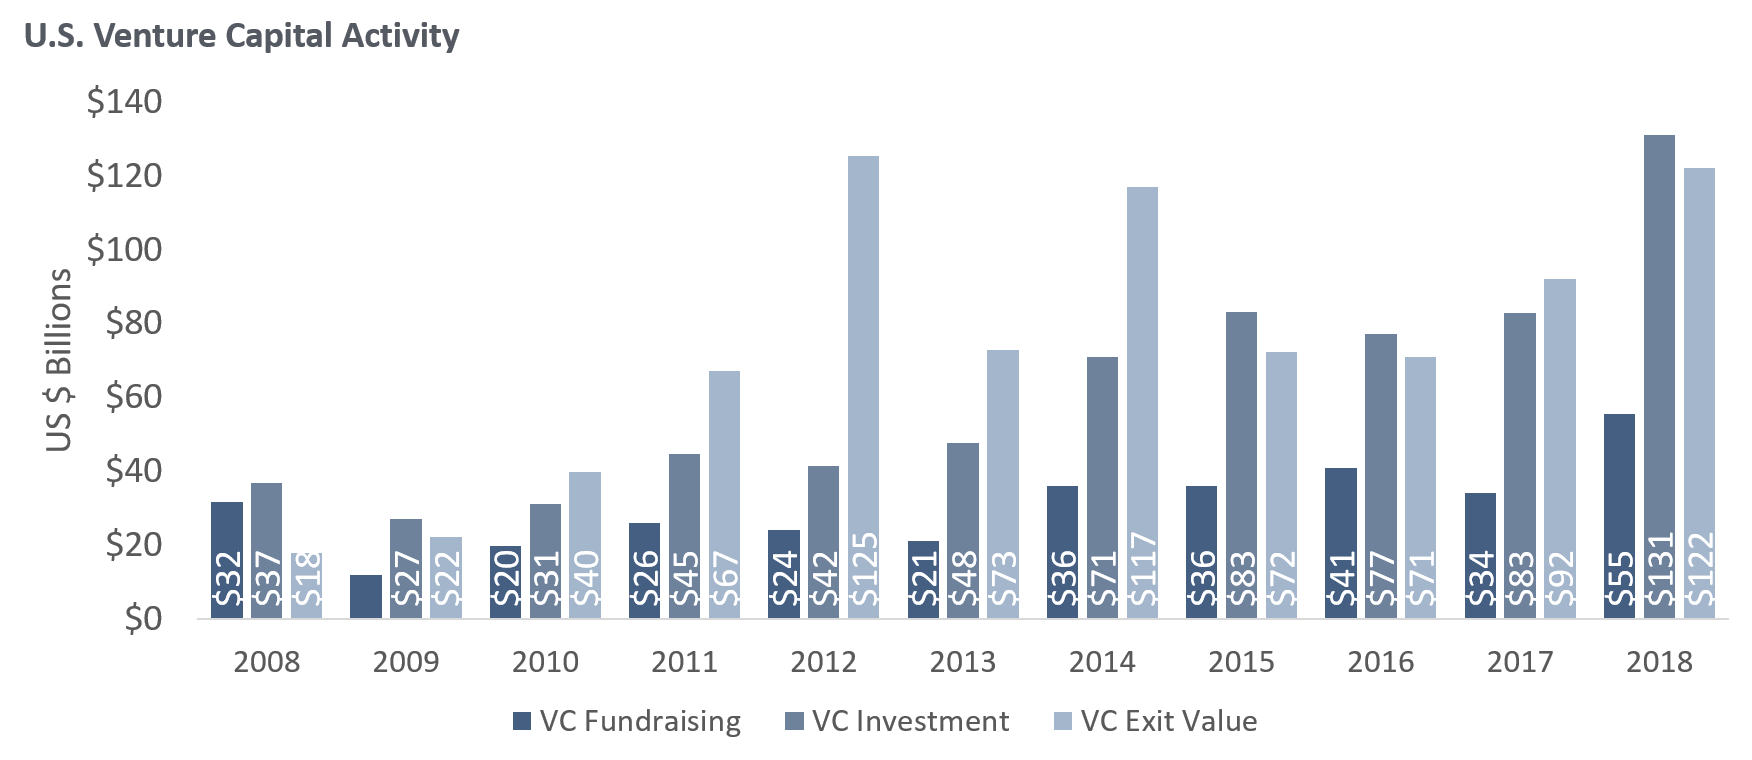
As the chart below demonstrates, over the past ten years domestic VC activity has been steadily increasing across all three major dimensions: fundraising, investing, and exits.

Source: 4Q 2018 PitchBook-NVCA Venture Monitor
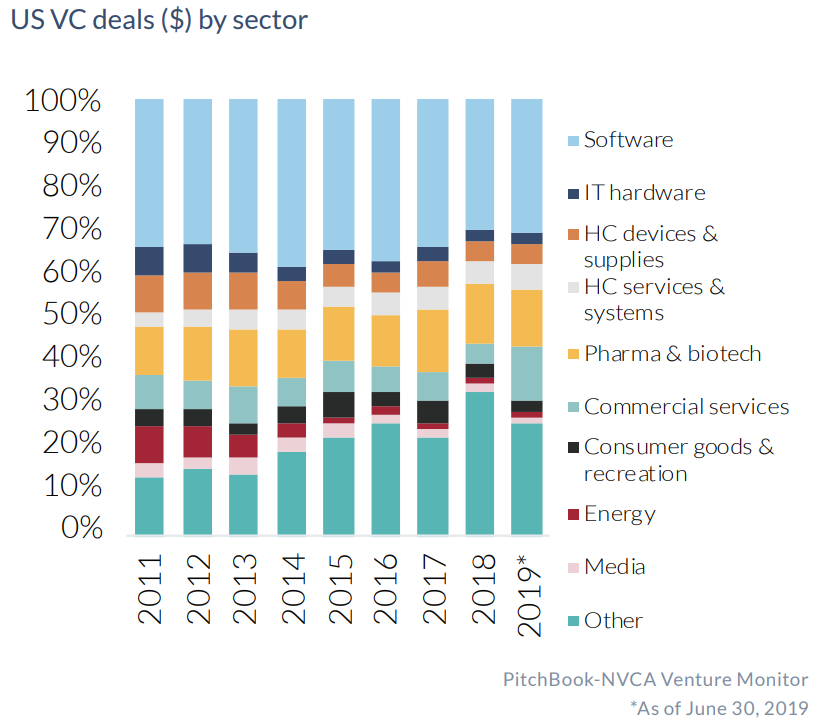
The VC industry is not only getting bigger, but it is also becoming more diverse. In the chart below, notice how the share of investment into “other” industries has increased from about 10% in 2011 to a peak of 30% in 2018. Given that $131 billion was invested in 2018 versus just $45 billion in 2011, that means roughly $40 billion was invested in non-traditional sectors in 2018 versus just $5 billion in 2011. In addition, software has fallen from its peak of nearly 40% in 2014 to just above 30% in 2019.
There have been two other significant changes in the industry in the past few years. First, companies are staying private for longer, which not only enables VC investors to capture more pre-IPO value, but also allows startups more runway to prove their business model and solidify their revenues. At the same time, the industry is moving toward more “mega” rounds, which are funding events in excess of $100M. These huge investments have contributed to the proliferation of so-called “unicorns,” venture backed firms valued at more than $1 billion.
In our view, both trends are positive for disciplined investors. We believe the VC industry has absorbed some of the downside risk by letting companies incubate longer. At the same time, these companies have a longer track record once they become publicly traded, so we have more data to work with when we attempt to assess their prospects and compute valuations.
Patience Is a Virtue
We generally prefer to take a patient approach to investing in new public firms, even if we are bullish on the business. In our experience, the first several months following an IPO are a good time to stay on the sidelines as it allows the hype cycle to dissipate.
Perhaps more importantly, if a new stock is doing well after its IPO, we find that market technicals have an outsized impact on the share price relative to the fundamentals. Specifically, IPOs are generally oversubscribed due to limited supply, which artificially boosts prices. At the same time, lockup restrictions placed on company insiders further reduce supply, adding to the inflated prices. The combination distorts the company’s value on a temporary basis, and we prefer to wait till the pressure abates. On the other hand, if a company’s share price is falling after its IPO, we don’t want to invest even if we feel the business is attractive. We’d prefer to wait till the company finds a pricing floor.
Ultimately, our approach to investing in post-IPO companies is identical to the other positions in our portfolio. We only invest in firms that we believe can deliver sustainable secular revenue growth, and we are committed to purchasing these companies at reasonable prices so we can maximize our returns.
Case Studies
Two of our recent post-IPO positions were each purchased about two years after the companies went public. In both cases, we monitored the stocks until we had confidence in each company’s growth prospects and we felt the valuations were reasonable.
Planet Fitness (PLNT)
Planet Fitness is a national chain of budget-friendly health clubs with monthly dues that start at just $10 – a fraction of the cost of a typical boutique club.
The company went public in August of 2015, and for nearly two years following the IPO the stock was essentially flat. During that period, the company was aggressively expanding its footprint, increasing from ~1,000 locations to over 1,500, leading to both higher revenues and increased costs. Despite the company’s rapid growth, the stock was stuck in a holding pattern because the market felt the valuation was too rich (i.e., its earnings multiple was too high).
We liked the company’s growth trajectory, but we agreed about the valuation, so we stayed out of the stock for 18 months. We also liked the company’s approach to expansion – it built many of its new clubs in areas where previous retailers had closed due to online competition, so it was able to negotiate favorable rents in well-trafficked spots.
In April of 2017, we felt the valuation made sense relative to the growth prospects (i.e., the earnings had increased materially while the share price stayed mostly flat), and we decided to enter the position. We continue to hold it in our portfolio.
Etsy (ETSY)
Etsy (ETSY) is an online marketplace that brings together sellers and buyers of handmade arts and crafts. The company went public in April of 2015 and its shares began declining immediately, losing 75% in the first nine months before rallying modestly in 2016.
The company was well-positioned when it went public, as it was the first online marketplace to feature vintage and custom goods, but an inefficient management team prevented the company from achieving its full potential. Growth was lagging and expenses were rising.
In May of 2017, about two years after the IPO, Etsy replaced its CEO, and the company rapidly began to improve. We were personally familiar with the new CEO from his previous stints at eBay and Skype, and we had confidence he would be able to turn the company around. In September of that year, we initiated our position in the company, and we have held it ever since.
Conclusion
The venture capital industry has taken over 200 startups public in the last two years, but very few have been a fit for our portfolio. Some have performed too poorly, a handful of others have been too big (i.e., their market cap has exceeded our maximum threshold), and the rest have not grown fast enough to align with our investment objective. As growth managers we are laser focused on investing only in firms that we believe can sustain strong secular revenue growth and that we can acquire at reasonable prices. Taking a patient approach to venture-backed, post-IPO companies has been an excellent way to add high quality emerging businesses to our portfolio.
1 - “Initial Public Offerings: Updated Statistics,” Jay R. Ritter, University of Florida

James Callinan, CFA
Chief Investment Officer – Small Cap Growth
Opportunity Fund Quarter-End Performance (as of 3/31/25)
| Fund | 1 MO | QTD | YTD | 1 YR | 3 YR | 5 YR | 10 YR |
INCEP (10/1/2012) |
|---|---|---|---|---|---|---|---|---|
| OSTGX | -7.77% | -14.87% | -14.87% | -6.98% | 1.81% | 13.87% | 11.06% | 12.75% |
| Russell 2000 Growth Index | -7.58% | -11.12% | -11.12% | -4.86% | 0.78% | 10.78% | 6.14% | 9.00% |
Gross/Net expense ratio as of 3/31/24:1.20% / 1.12%. The Adviser has contractually agreed to waive certain fees through June 30, 2025. The net expense ratio is applicable to investors.
Performance data quoted represent past performance; past performance does not guarantee future results. The investment return and principal value of an investment will fluctuate so that an investor’s shares, when redeemed, may be worth more or less than their original cost. Current performance of the Fund may be higher or lower than the performance quoted. Performance data current to the most recent month end may be obtained by calling shareholder services toll free at (866) 236-0050. Performance prior to December 1, 2016 is that of another investment vehicle (the “Predecessor Fund”) before the commencement of the Fund’s operations. The Predecessor Fund was converted into the Fund on November 30, 2016. The Predecessor Fund’s performance shown includes the deduction of the Predecessor Fund’s actual operating expenses. In addition, the Predecessor Fund’s performance shown has been recalculated using the management fee that applies to the Fund, which has the effect of reducing the Predecessor Fund’s performance. The Predecessor Fund was not a registered mutual fund and so was not subject to the same operating expenses or investment and tax restrictions as the Fund. If it had been, the Predecessor Fund’s performance may have been lower.
Rates of return for periods greater than one year are annualized.
Where applicable, charts illustrating the performance of a hypothetical $10,000 investment made at a Fund’s inception assume the reinvestment of dividends and capital gains, but do not reflect the effect of any applicable sales charge or redemption fees. Such charts do not imply any future performance.
The Russell 2000 Growth Index (Russell 2000G) is a market-capitalization-weighted index representing the small cap growth segment of U.S. equities. This index does not incur expenses, is not available for investment and includes the reinvestment of dividends.
References to specific companies, market sectors, or investment themes herein do not constitute recommendations to buy or sell any particular securities.
There can be no assurance that any specific security, strategy, or product referenced directly or indirectly in this commentary will be profitable in the future or suitable for your financial circumstances. Due to various factors, including changes to market conditions and/or applicable laws, this content may no longer reflect our current advice or opinion. You should not assume any discussion or information contained herein serves as the receipt of, or as a substitute for, personalized investment advice from Osterweis Capital Management.
Complete holdings of all Osterweis mutual funds (“Funds”) are generally available ten business days following quarter end. Holdings and sector allocations may change at any time due to ongoing portfolio management. Fund holdings as of the most recent quarter end are available here: Opportunity Fund
Opinions expressed are those of the author, are subject to change at any time, are not guaranteed and should not be considered investment advice.
Mutual fund investing involves risk. Principal loss is possible. The Osterweis Opportunity Fund may invest in unseasoned companies, which involve additional risks such as abrupt or erratic price movements. The Fund may invest in small and mid-sized companies, which may involve greater volatility than large-sized companies. The Fund may invest in IPOs and unseasoned companies that are in the early stages of their development and may pose more risk compared to more established companies. The Fund may invest in ETFs, which involve risks that do not apply to conventional funds. Higher turnover rates may result in increased transaction costs, which could impact performance. From time to time, the Fund may have concentrated positions in one or more sectors subjecting the Fund to sector emphasis risk. The Fund may invest in foreign and emerging market securities, which involve greater volatility and political, economic and currency risks and differences in accounting methods. These risks may increase for emerging markets.
Holdings and allocations may change at any time due to ongoing portfolio management. References to specific investments should not be construed as a recommendation to buy or sell the securities. Current and future holdings are subject to risk.
The Osterweis Emerging Opportunity Fund’s top 10 holdings may be viewed by clicking here.
The Osterweis Funds are available by prospectus only. The Funds’ investment objectives, risks, charges, and expenses must be considered carefully before investing. The summary and statutory prospectuses contain this and other important information about the Funds. You may obtain a summary or statutory prospectus by calling toll free at (866) 236-0050, or by visiting www.osterweis.com/statpro. Please read the prospectus carefully before investing to ensure the Fund is appropriate for your goals and risk tolerance.
Osterweis Capital Management is the adviser to the Osterweis Funds, which are distributed by Quasar Distributors, LLC. [41779]


