Investment grade (IG) bonds have always been the primary option for core fixed income allocations, and on paper the logic is sound. The IG universe is diverse, default risk is minimal, and liquidity is high. Moreover, IG bonds can act as a buffer when equity markets stumble.
However, in the nearly two decades since the Great Financial Crisis (GFC), IG has revealed its limitations – first during the two zero interest rate periods, and more recently during the latest Fed tightening cycle. In each case, investors were reminded that interest rate risk can adversely impact IG returns, even in the absence of credit risk.
In our view, the best way to protect your core IG allocation is to combine it with an actively managed, flexible strategy that can react to changing market conditions in real time. Not only can these types of strategies limit downside when rates are rising, they can pursue higher yielding alternatives when rates bottom out. Traditional, benchmark-oriented strategies are required to invest roughly the same way regardless of the economic environment and/or the relative merits of a particular sector, which leads to predictably negative returns when conditions are unfavorable.
OSTIX: Flexibility Without Stretching
Our philosophy has always been rooted in common sense. We search for the most attractive areas of the market given the conditions – often high yield (HY) bonds – and then we try to find the least risky way to invest there (mostly by shortening duration, but not always). As you can see from the chart below, we significantly ramped up our HY allocation starting in 2009, after the GFC, when the Fed and other central banks committed to zero (and, in some cases, negative) interest rate policies that lasted until 2016. During that stretch, IG bonds were delivering consistently meager returns, and we felt that HY made much more sense. (As an aside, prior to the GFC we were invested in a more balanced mix of HY, IG, and convertibles.) We have remained primarily in high yield bonds since 2009, as we continue to believe they offer a more attractive risk/return profile than investment grade bonds, but, as you can also see, we have reduced our HY exposure during each of the past two Fed tightening regimes.
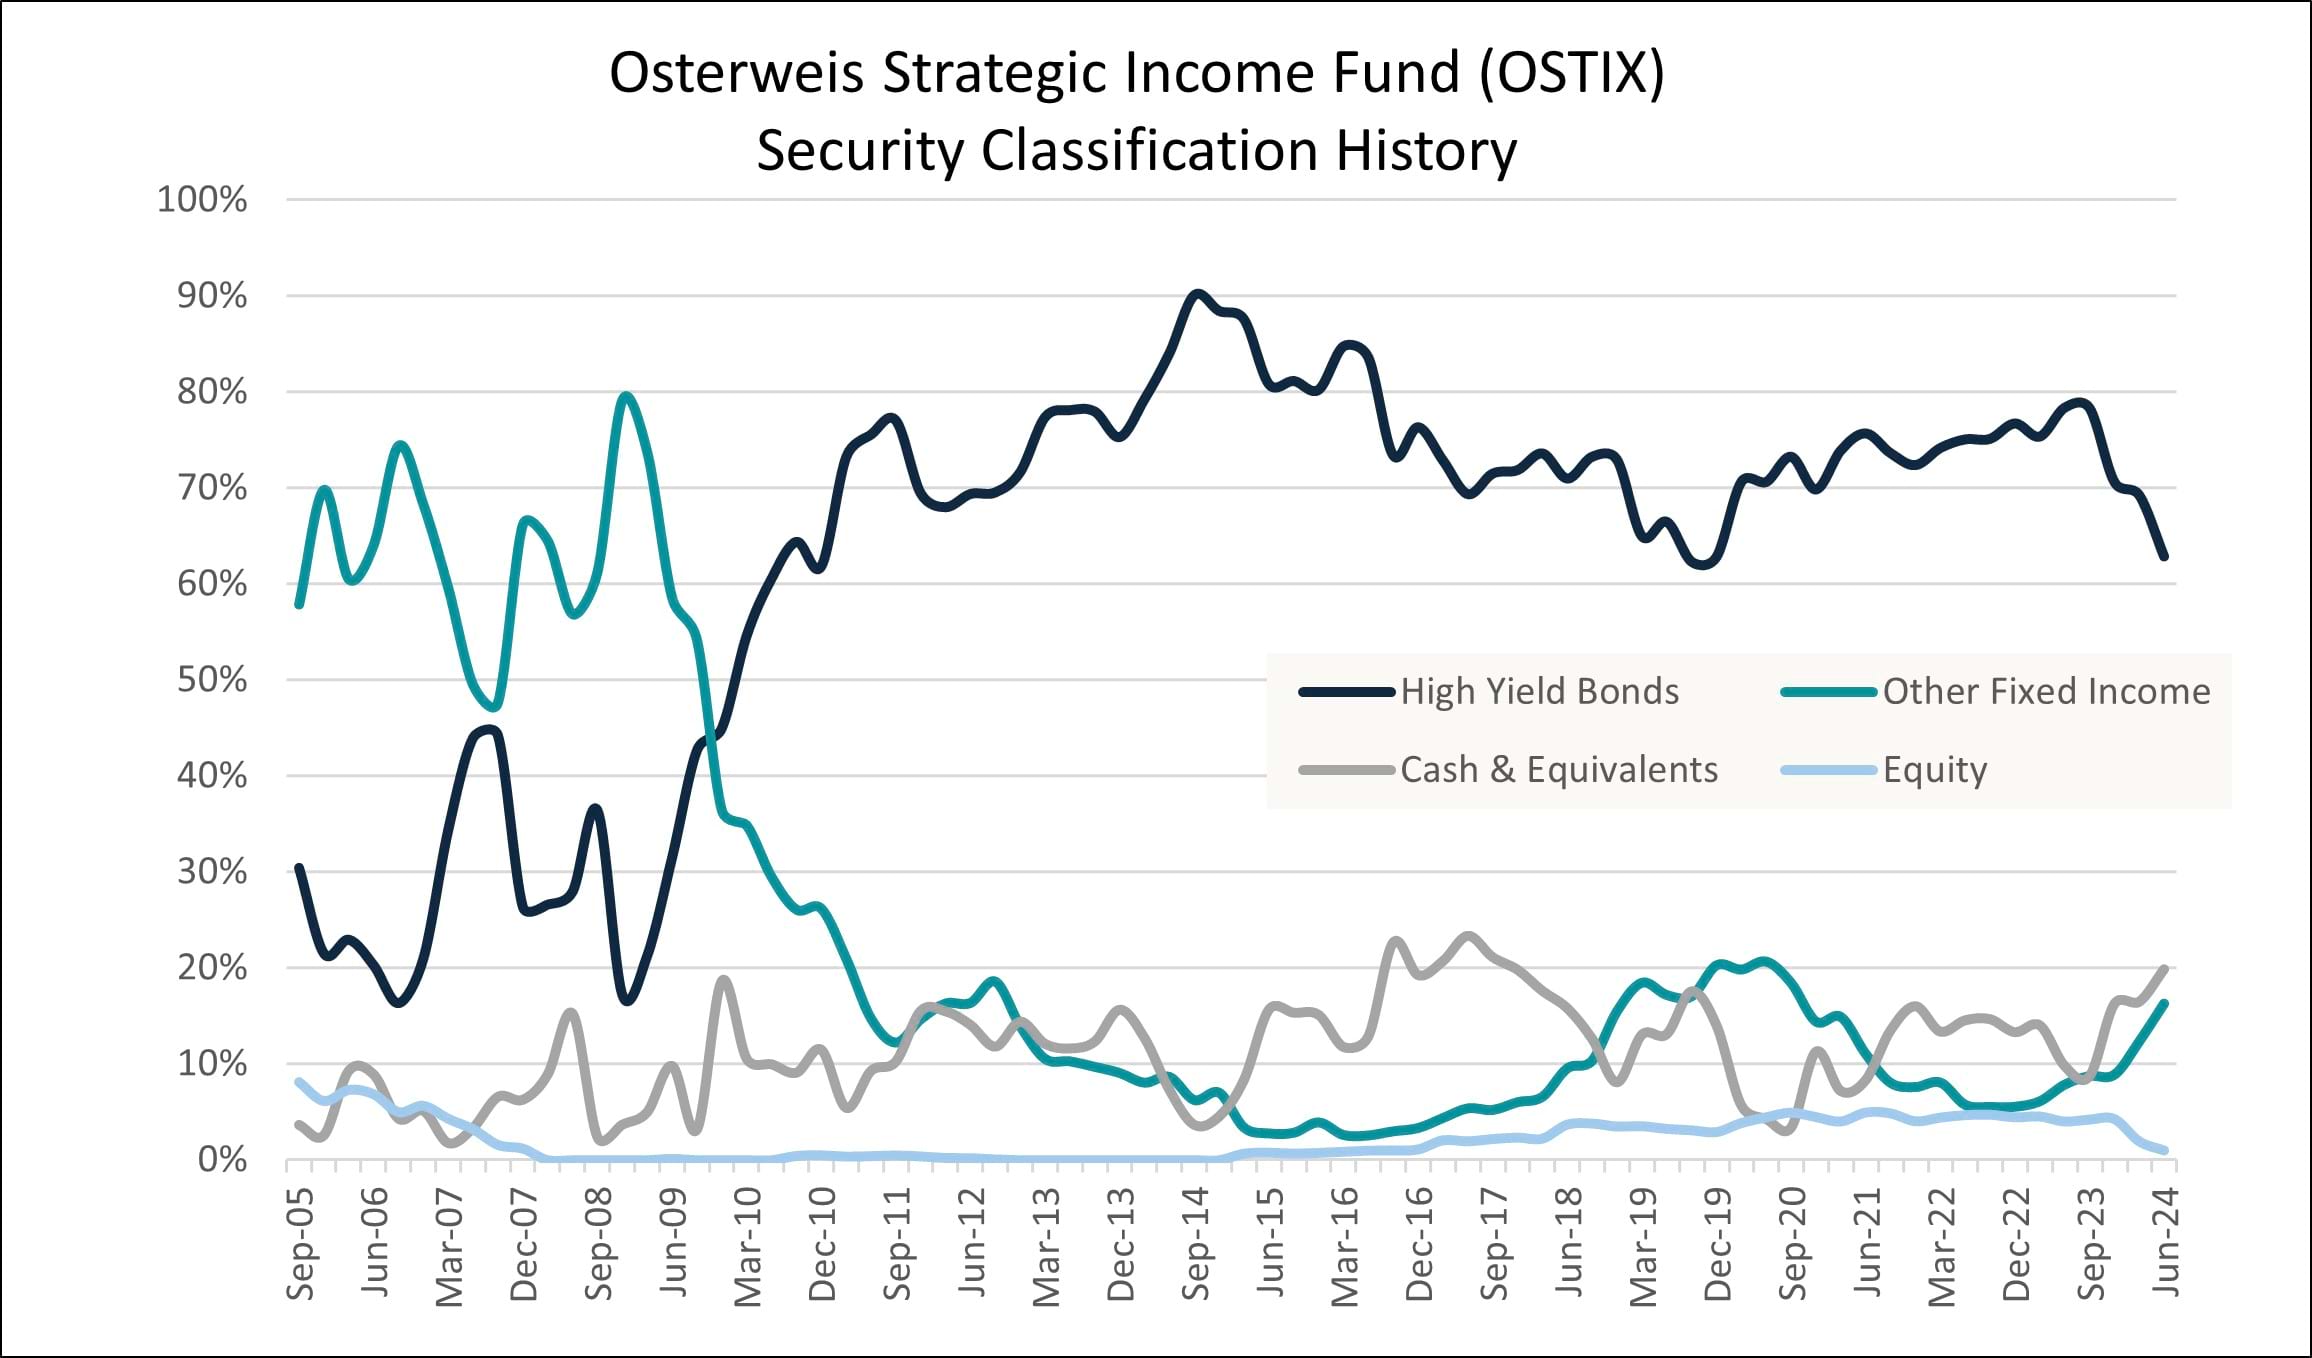
Source: Osterweis Capital Management. The “Other Fixed Income” category consists of IG bonds, convertibles, preferred stock, Treasurys, private MBS, floating rate bonds, and short-term debt (including HY). Prior to 2016, HY bonds maturing within one year were classified as short-term debt and included in "Other Fixed Income”; thereafter such short-term HY bonds were included in the “High Yield” category. Equities consist primarily of stocks received through corporate actions.
We understand that high yield bonds are not typically associated with a core fixed income allocation, but they have worked well for us because we increase/decrease our exposure based on the economic environment and curate what we believe is a more creditworthy selection of companies from the HY universe. Moreover, we pair our HY bonds with cash and other lower-risk securities to dampen our portfolio volatility in times of market exuberance, thereby softening the potential impact of subsequent market corrections. Because HY bonds generally yield more than IG bonds, we do not have to stretch for yield by extending duration or taking excess credit risk. We have been investing this way for over 20 years, and we have delivered substantially higher returns than the Bloomberg U.S. Aggregate (Agg) since our inception, while keeping our volatility nearly in line with the index.
Not All High Yield Is Junk
In our view, high yield bonds, also sometimes referred to as “junk,” are a largely misunderstood asset class.1 The distinction between an IG bond and a HY bond is determined entirely by its credit rating. If Moody’s and S&P assign a rating above the cutoff (Ba1 and BB+, respectively), a bond is considered investment grade. If not, it is high yield. We have always felt that dividing such a large and dynamic market into two giant buckets is an oversimplification, and we have dedicated ourselves to exploiting the inefficiencies it creates.
Setting aside the issue that a rating is merely one subjective opinion, roughly 50% of the HY index is BB and 50% of the IG corporate index is BBB. In other words, approximately half of each universe is on the border, which means they have fairly similar default risk.
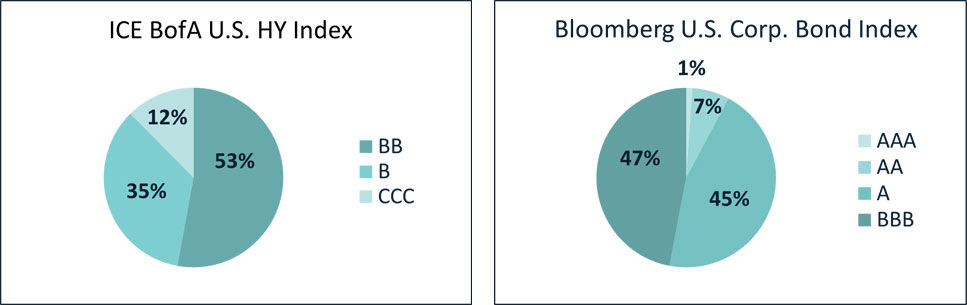
Source: ICE Indices and Barclays Live
The table below shows the annualized default rates of each ratings grade over 5-year, 10-year, and 15-year periods. While the default risk is a little higher for BB than for BBB bonds, the absolute level of risk is still relatively low. Obviously, the risks increase as you move down the ratings scale, but statistically speaking a high-quality HY bond is not substantially different from a low-quality IG bond.
The last row of the table shows the default rates for OSTIX. As you can see, our 5-year rate is slightly above the A category, while our 10-year rate is roughly half the BB rate, and our 15-year rate is only11 basis points higher than the BBB rate. In other words, over the long run, the credit risk of our portfolio, which has been primarily high yield bonds, is similar to an investment grade portfolio.
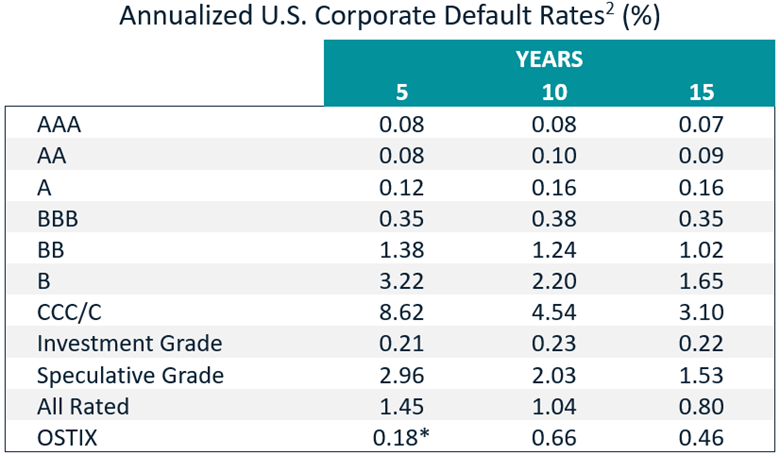
Source: S&P and Osterweis Capital Management. Data as of 12/31/23. *Note that our 5-year default rate as of 9/30/24 is 0.0%, as we have not had a default in that time.
In addition, the correlation between a bond’s spread, which is the market’s real-time assessment of its credit risk, and its rating is fairly low. Said differently, a BB bond, which is at the top of the HY spectrum, and a CCC bond, which is at the bottom, can have similar spreads, suggesting that once a bond is trading in the open market, most investors do not place much weight on its rating. As you can see in the chart below, every ratings category except the very lowest has a cohort of bonds trading at spreads between 200-500 basis points.
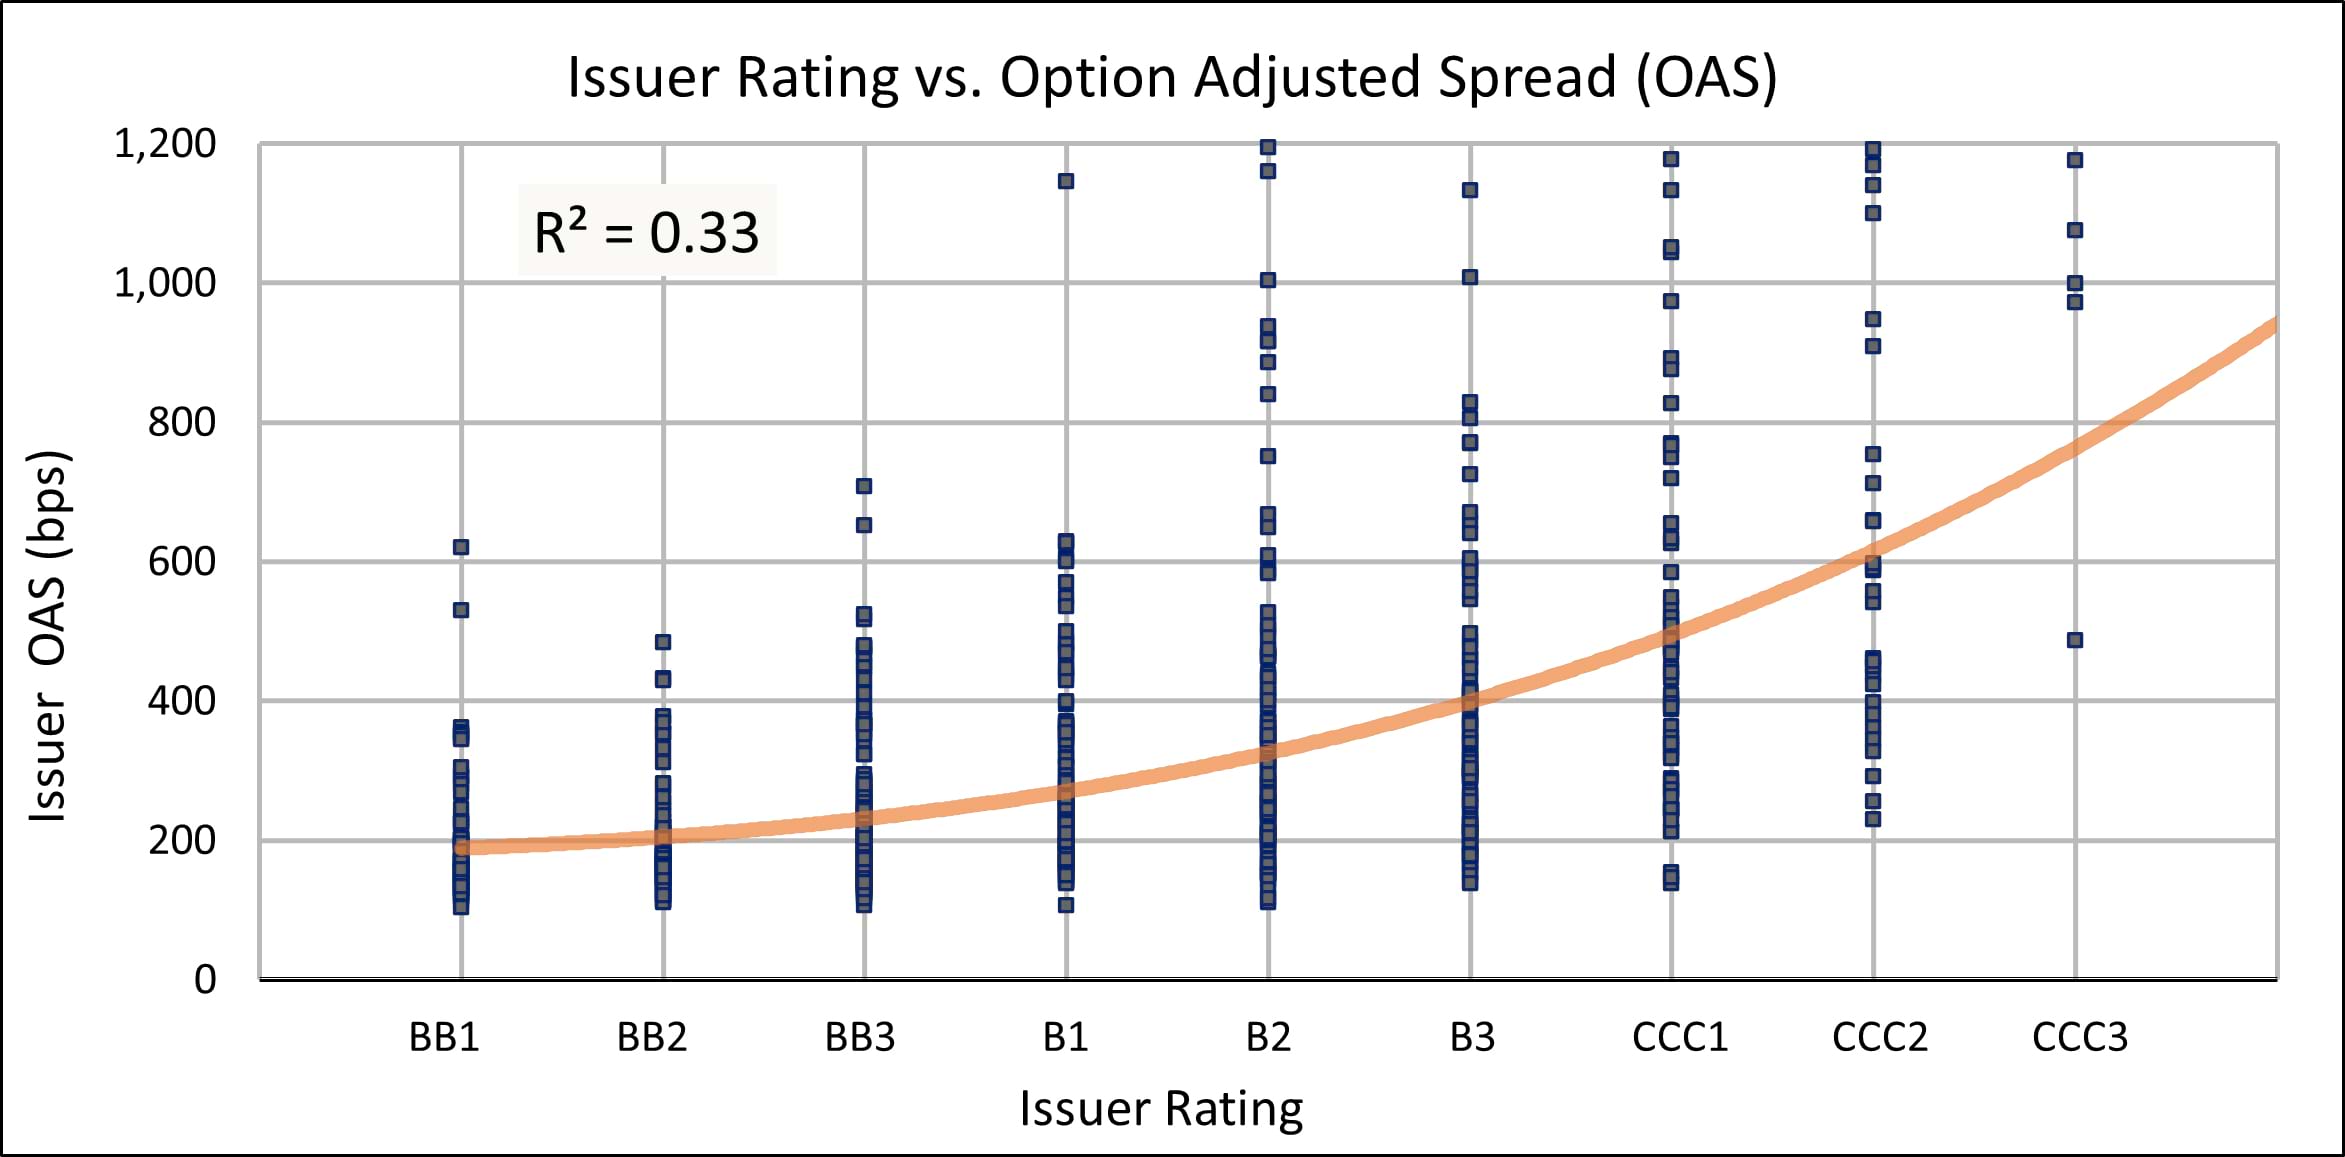
Source: Bank of America Global Research. Data as of June 2024. The dashed lines represent the boundary between 200-500 bps. The curve is the regression line showing the OAS mid-point of each rating grade.
In summary, we believe that there is strong empirical evidence that ignoring HY and dismissing it as “too risky” for a core allocation is essentially a missed opportunity. In our view, leaning into HY, but doing so in a strategic and selective manner, is among the smartest decisions a fixed income investor can make. Because the asset class is so stigmatized, knowledgeable investors can exploit market inefficiencies that others are simply overlooking.
Aligned Incentives Are the Key
Perhaps our belief in the benefits of HY bonds is rooted in our experience. For over two decades we have been investing in the space, and during that time we have developed an approach to evaluating borrowers that has seldom let us down. Like all managers, we strive to find companies with strong fundamentals and good credit metrics (e.g., coverage ratios, leverage ratios, healthy free cash flow), but we have also always looked for something else that we believe is at least as important. Namely, we are looking to lend money to companies whose incentives are aligned with our own.
For us, it is essential that the borrowers are using leverage strategically and transparently, and that they invest directly into their business, rather than pay themselves large dividends or repurchase their own shares. The classic example is a company that borrows money to build a new factory or expand its geographic footprint – these kinds of investments give the business a chance to grow in the future, which increases its enterprise value and improves the likelihood it will repay its debts in full. In short, we are looking for companies that we believe are good stewards of capital, as they will borrow responsibly and prioritize repayment.
In addition, these types of businesses tend to incorporate stronger covenants into their bonds, which gives us additional protections beyond the company’s verbal promise to repay. Also, they are generally more inclined to allow direct access to their executive teams. This not only helps us conduct stronger due diligence, as we can ask management questions about their business plan, but it also enables us to provide strategic advice in situations where they may need guidance navigating the capital markets.
When we are evaluating a new position, we have found these factors are much more important than a bond’s credit rating, although we tend to be underweight CCCs, as they do not usually meet our investment criteria.
Avoid the Herds
Another technique we use to manage risk is to avoid the most crowded areas of the market, as securities with strong demand are often not particularly attractive. For example, larger bonds that are included in a fixed income index tend to offer below-market yields, as passive funds are essentially required to buy them in order to match their benchmark. As a result, issuers know their bonds will be purchased even if the coupons are below market.
Conversely, sponsor-backed leveraged buyouts (LBOs) have tended to offer competitive yields, which makes them highly sought after, but the terms of the deals are usually quite unfavorable for investors. LBOs are typically led by private equity companies that saddle the underlying business with substantial levels of debt, and they frequently use the proceeds to pay themselves generous dividends. The net result is a company that is left with significantly higher debt service but no improvement in its ability to pay, as they generally have the same base of operations as before the deal.
A Track Record of Success
Our goal has never been to beat a specific index – it has always been to invest in the areas of the market with the most attractive risk/return profiles. Because we have been consistently overweight HY for most of the past two decades, we have substantially outperformed the Agg over that stretch. At the same time, because our HY exposure has always been less than 100%, and has fluctuated according to the market conditions, we have lagged the ICE BofA HY Index, but with substantially less volatility. We have, in essence, deliberately pursued a middle ground, as this allowed us to increase our returns without significantly increasing our risk. As you can see from the chart below, our performance lies almost directly between the IG and HY indices, and our drawdowns during market selloffs are substantially less severe than those of the HY index.
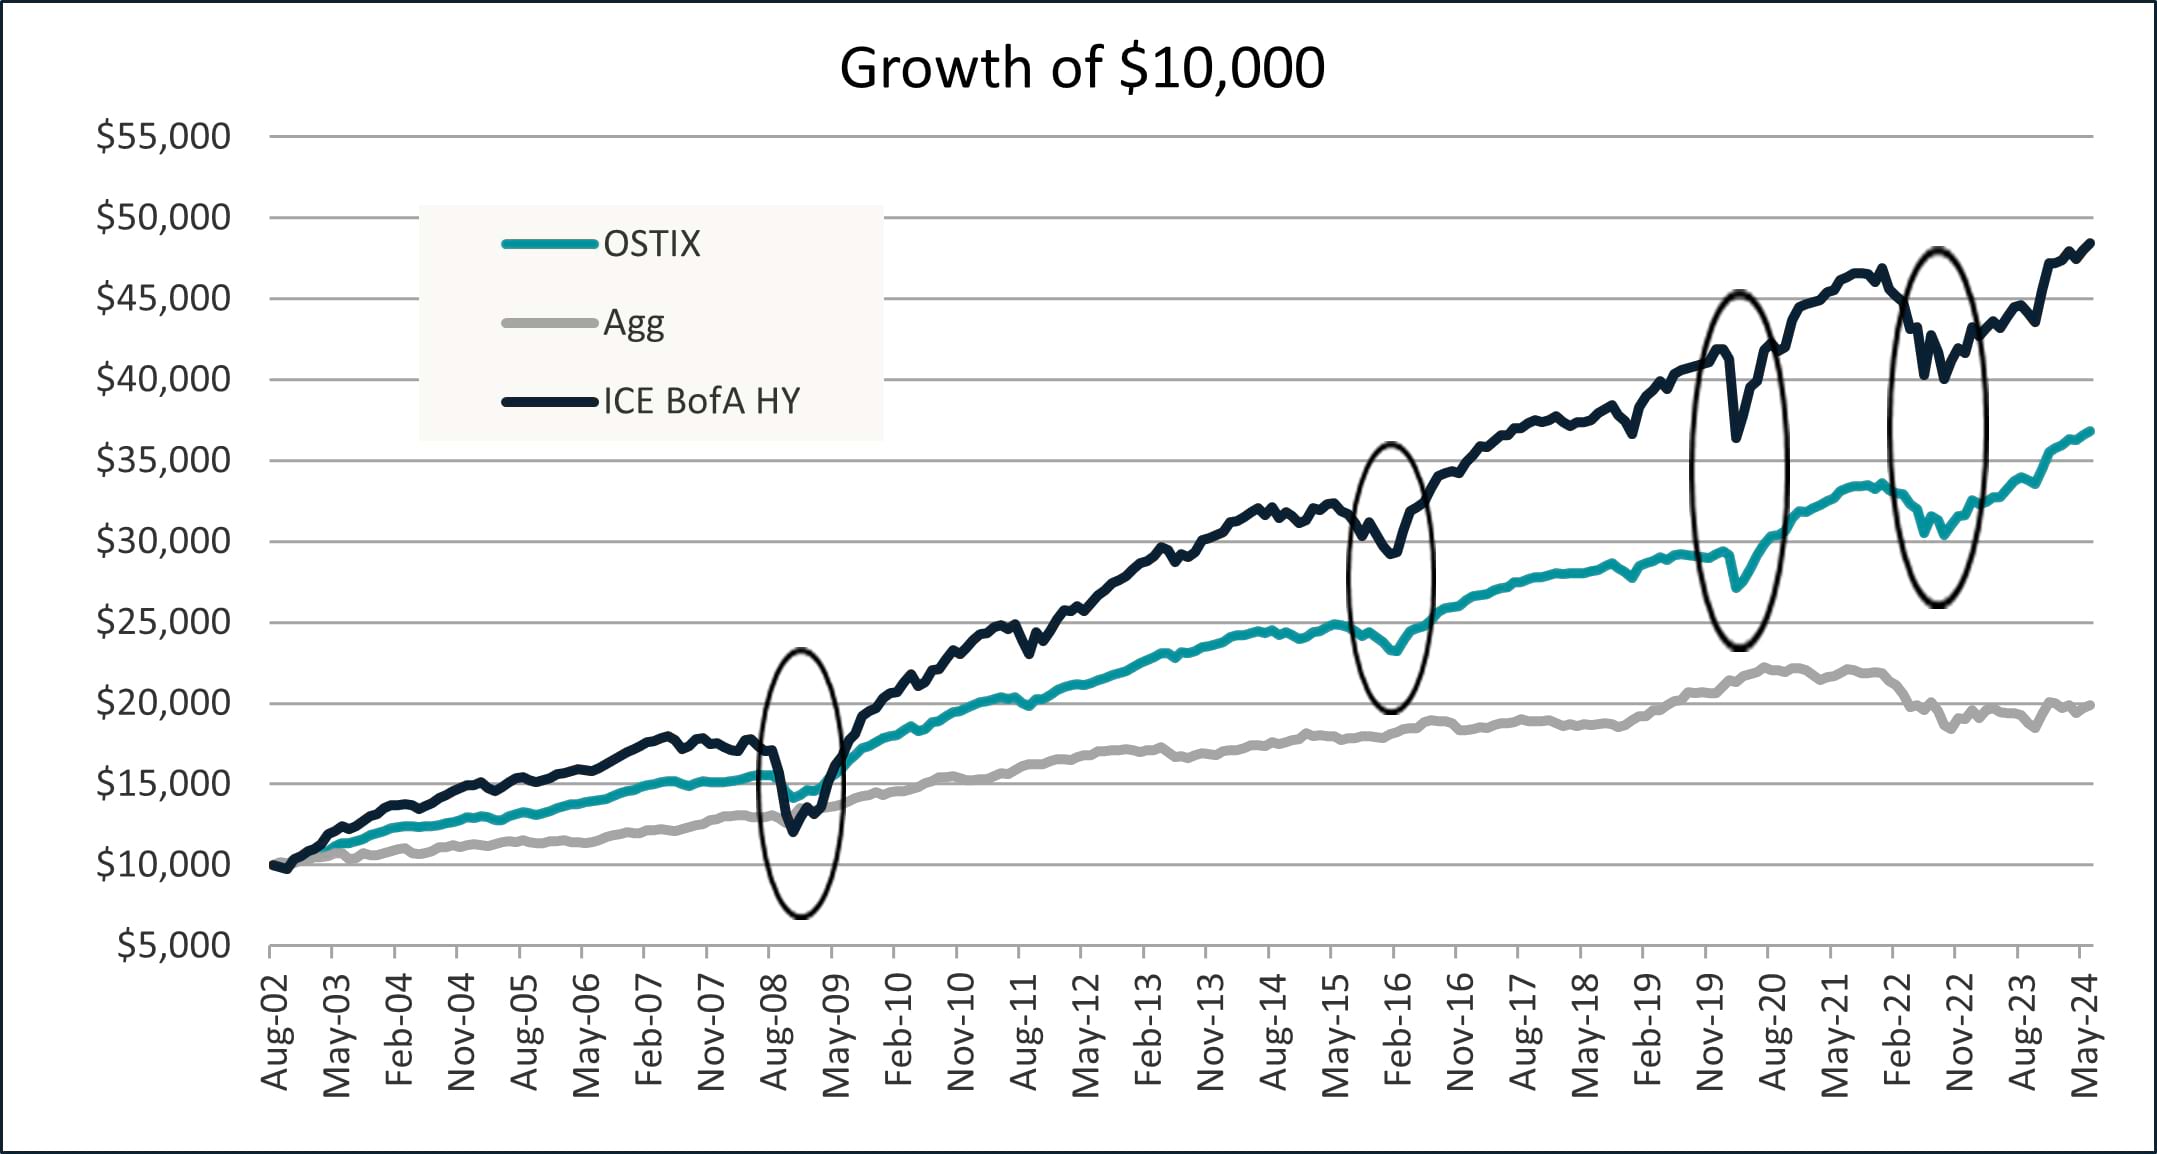
Source: Bloomberg Indices, ICE Indices, Osterweis Capital Management. Data as of 8/30/02-6/30/24. Chart illustrates the performance of a hypothetical $10,000 investment made at the Fund’s inception and assumes the reinvestment of dividends and capital gains, but does not reflect the effect of any applicable sales charge or redemption fees. Such charts do not imply any future performance.
Performance data quoted represent past performance; past performance does not guarantee future results. The investment return and principal value of an investment will fluctuate so that an investor’s shares, when redeemed, may be worth more or less than their original cost. Current performance of the Fund may be higher or lower than the performance quoted. Performance data current to the most recent month end may be obtained by calling shareholder services toll free at (866) 236-0050.
The table below puts a finer point on the fund’s ability to deliver returns while still managing volatility. As you can see, over the past 20 years, our return is substantially higher than the Agg, our standard deviation is nearly identical, and our Sharpe ratio is significantly higher than both indices.
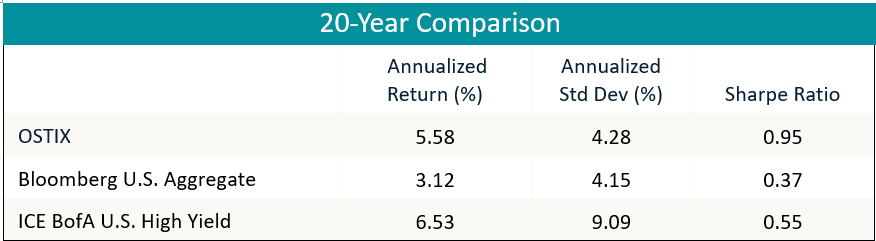
Source: eVestment. Data as of 6/30/24. Please see disclosures for standardized performance chart.
Final Thoughts
In our view, investors have been thinking too narrowly about their core fixed income allocation for too long. Interest rate cycles have predictable results for investors of traditional core funds, which generally track the Agg. Those funds will almost always struggle when interest rates rise, as their managers have limited options available to protect their portfolios. Likewise, they will struggle when the Fed cuts rates aggressively, as they will not generate enough yield to deliver meaningful returns.
An actively managed, flexible strategy, on the other hand, has the ability to move into sectors that are suited to a particular environment (and vice versa), whether the change is triggered by an interest rate move or a change in the credit cycle. As we have demonstrated over the past 20+ years, being nimble in the fixed income market is more important than adhering to the orthodoxy around what makes up a “core” fund.
1 You can watch a replay of our webinar, "Not All High Yield Is Junk," to hear our detailed thoughts on the virtues of high yield bonds.
2 The figures in the non-OSTIX rows in the above table are calculated by S&P for corporate bonds. The OSTIX default rates are calculated by Osterweis using all the bonds held by OSTIX and are based on a methodology similar to that of the S&P.
Carl Kaufman
Co-President, Co-Chief Executive Officer, Chief Investment Officer – Strategic Income & Managing Director – Fixed Income
Craig Manchuck
Vice President & Portfolio Manager – Strategic Income
Bradley Kane
Vice President & Portfolio Manager – Strategic Income
John Sheehan, CFA
Vice President & Portfolio Manager – Strategic Income
Featuring


Carl Kaufman
Co-President, Co-Chief Executive Officer, Chief Investment Officer – Strategic Income & Managing Director – Fixed Income
Carl Kaufman
Co-President, Co-Chief Executive Officer, Chief Investment Officer – Strategic Income & Managing Director – Fixed Income
Carl Kaufman serves in several key roles for the firm. He has managed the Osterweis Strategic Income Fund since its inception and serves as the Managing Director of Fixed Income, as well as a co-lead Portfolio Manager for the Osterweis Growth & Income Fund. Additionally, in his role as Co-President & Co-CEO he oversees key investment matters and is an integral part of the firm’s Management Committee.
He joined Osterweis Capital Management in 2002, after nearly 24 years at Robertson Stephens and Merrill Lynch.
Carl graduated from Harvard University and attended New York University Graduate School of Business Administration.
Outside his professional endeavors, he enjoys playing classical piano and actively contributes to the community as a member of the Board of Trustees for the San Francisco Conservatory of Music, supporting the arts and enhancing the cultural fabric of the SF Bay Area. Additionally, he enjoys playing golf, an activity that continually challenges his patience and precision.


Craig Manchuck
Vice President & Portfolio Manager – Strategic Income
Craig Manchuck, a partner at Osterweis, is a Portfolio Manager for the strategic income strategy. In this role he enjoys investing clients’ assets in a common sense way that is designed to generate good risk-adjusted returns. Throughout his career, Craig has learned the importance of patience and that relationships with company management teams are invaluable.
Prior to joining Osterweis Capital Management in 2017, Craig was a Managing Director of Fixed Income Sales at Stifel Nicolaus, where he was responsible for sales and origination of high yield bonds, leveraged loans, and post reorg equities. Before Stifel, he held a similar role at Knight Capital. Before that, Craig was the Executive Director for Convertible Securities and then High Yield/Distressed Securities at UBS. He has previous experience in Convertible Securities Sales at Donaldson, Lufkin & Jenrette, SBC Warburg, and Merrill Lynch.
Craig graduated from Lehigh University with a B.S. in Finance and NYU Stern School of Business with an M.B.A. Outside of work, he enjoys golfing, wine, gardening, and spending time with family.


Bradley Kane
Vice President & Portfolio Manager – Strategic Income
Bradley (Brad) Kane is a Portfolio Manager for the strategic income strategy and a partner at the firm. In his role he leverages his extensive experience and deep understanding of the market to seek out opportunities to deliver clients attractive risk-adjusted returns.
Prior to joining Osterweis in 2013, Brad was a Portfolio Manager and Analyst at Newfleet Asset Management, where he managed both high yield and leveraged loan portfolios. Before that, he was a Vice President at GSC Partners, focusing on management of high yield and collateralized debt obligations. Earlier in his career, he managed high yield assets as a Vice President at Mitchell Hutchins Asset Management. In these positions he learned the importance of staying focused on one’s investing strategy and discovering new securities and investor types without succumbing to trends.
Brad graduated from Lehigh University with a B.S. in Business & Economics. Outside of his professional life, he enjoys playing golf and ice hockey, as well as indulging in his diverse taste in music, including a particular appreciation for heavy metal.


John Sheehan, CFA
Vice President & Portfolio Manager – Strategic Income
John Sheehan, a partner at Osterweis, is a Portfolio Manager for the strategic income strategy. In his role he appreciates the opportunity to contribute to clients feeling confident that their investments are positioned to meet their long-term goals. As a portfolio manager, he likes that the bond market is an ever-evolving game that blends art and science.
Prior to joining the Strategic Income team at the end of 2023, John was a portfolio manager for the total return strategy. Before that, he spent more than 20 years working at Citigroup, first as Managing Director responsible for Investment Grade Syndicate in New York City, where he advised issuers on accessing funding in the corporate bond market. Later at Citigroup, he was Managing Director in charge of West Coast Investment Grade Sales in San Francisco, where he covered several of the largest U.S. investment grade credit investors.
John graduated from Georgetown University with a B.A. in Economics. He holds the CFA designation and is a member of the CFA Society of San Francisco. Outside of work, John enjoys swimming and skiing with his family, as well as seeing live music.
For more information about this strategy, please send us an email or call us at (800) 700-3316.
Strategic Income Fund Quarter-End Performance (as of 12/31/25)
| Fund | 1 MO | QTD | YTD | 1 YR | 3 YR | 5 YR | 10 YR | 15 YR | 20 YR |
INCEP (8/30/2002) |
|---|---|---|---|---|---|---|---|---|---|---|
| OSTIX | 0.50% | 0.73% | 5.47% | 5.47% | 8.56% | 4.89% | 5.47% | 4.93% | 5.72% | 6.17% |
| Bloomberg U.S. Aggregate Bond Index | -0.15% | 1.10% | 7.30% | 7.30% | 4.66% | -0.36% | 2.01% | 2.42% | 3.25% | 3.39% |
Gross expense ratio as of 3/31/25: 0.83%
30 Day SEC Yield as of 12/31/25: 4.83%
Performance data quoted represent past performance; past performance does not guarantee future results. The investment return and principal value of an investment will fluctuate so that an investor’s shares, when redeemed, may be worth more or less than their original cost. Current performance of the Fund may be higher or lower than the performance quoted. Performance data current to the most recent month end may be obtained by calling shareholder services toll free at (866) 236-0050.
Rates of return for periods greater than one year are annualized.
Where applicable, charts illustrating the performance of a hypothetical $10,000 investment made at a Fund’s inception assume the reinvestment of dividends and capital gains, but do not reflect the effect of any applicable sales charge or redemption fees. Such charts do not imply any future performance.
The Bloomberg U.S. Aggregate Bond Index (Agg) is widely regarded as the standard for measuring U.S. investment grade bond market performance. This index does not incur expenses and is not available for investment. The index includes reinvestment of dividends and/or interest income.
Source for any Bloomberg index is Bloomberg Index Services Limited. BLOOMBERG® is a trademark and service mark of Bloomberg Finance L.P. and its affiliates (collectively “Bloomberg”). Bloomberg owns all proprietary rights in the Bloomberg Indices. Bloomberg does not approve or endorse this material, or guarantees the accuracy or completeness of any information herein, or makes any warranty, express or implied, as to the results to be obtained therefrom and, to the maximum extent allowed by law, neither shall have any liability or responsibility for injury or damages arising in connection therewith.
References to specific companies, market sectors, or investment themes herein do not constitute recommendations to buy or sell any particular securities.
There can be no assurance that any specific security, strategy, or product referenced directly or indirectly in this commentary will be profitable in the future or suitable for your financial circumstances. Due to various factors, including changes to market conditions and/or applicable laws, this content may no longer reflect our current advice or opinion. You should not assume any discussion or information contained herein serves as the receipt of, or as a substitute for, personalized investment advice from Osterweis Capital Management.
Complete holdings of all Osterweis mutual funds (“Funds”) are generally available ten business days following quarter end. Holdings and sector allocations may change at any time due to ongoing portfolio management. Fund holdings as of the most recent quarter end are available here: Strategic Income Fund
Mutual fund investing involves risk. Principal loss is possible. Past performance does not guarantee future results.
This commentary contains the current opinions of the authors as of the date above, which are subject to change at any time, are not guaranteed, and should not be considered investment advice. This commentary has been distributed for informational purposes only and is not a recommendation or offer of any particular security, strategy, or investment product. Information contained herein has been obtained from sources believed to be reliable but is not guaranteed.
The Osterweis Strategic Income Fund may invest in debt securities that are un-rated or rated below investment grade. Lower-rated securities may present an increased possibility of default, price volatility or illiquidity compared to higher-rated securities. The Fund may invest in foreign and emerging market securities, which involve greater volatility and political, economic and currency risks and differences in accounting methods. These risks may increase for emerging markets. Investments in debt securities typically decrease in value when interest rates rise. This risk is usually greater for longer-term debt securities. Small- and mid-capitalization companies tend to have limited liquidity and greater price volatility than large-capitalization companies. Higher turnover rates may result in increased transaction costs, which could impact performance. From time to time, the Fund may have concentrated positions in one or more sectors subjecting the Fund to sector emphasis risk. The Fund may invest in municipal securities which are subject to the risk of default.
The Osterweis Funds are available by prospectus only. The Funds’ investment objectives, risks, charges, and expenses must be considered carefully before investing. The summary and statutory prospectuses contain this and other important information about the Funds. You may obtain a summary or statutory prospectus by calling toll free at (866) 236-0050, or by visiting www.osterweis.com/statpro. Please read the prospectus carefully before investing to ensure the Fund is appropriate for your goals and risk tolerance.
The Bloomberg U.S. Corporate Investment Grade Bond Index measures the investment grade, fixed-rate, taxable corporate bond market. It includes U.S. dollar-denominated securities publicly issued by U.S. and non-U.S. industrial, utility and financial issuers.
The ICE BofA U.S. High Yield Index tracks the performance of U.S. dollar denominated below-investment grade corporate debt publicly issued in the U.S. domestic market.
{indices_expenses}
Effective 6/30/22, the ICE indices reflect transactions costs. Any ICE index data referenced herein is the property of ICE Data Indices, LLC, its affiliates (“ICE Data”) and/or its Third Party Suppliers and has been licensed for use by Osterweis Capital Management. ICE Data and its Third Party Suppliers accept no liability in connection with its use. See https://www.osterweis.com/glossary for a full copy of the Disclaimer.
Yield is the income return on an investment, such as the interest or dividends received from holding a particular security.
Spread is the difference in yield between a risk-free asset such as a Treasury bond and another security with the same maturity but of lesser quality.
A basis point is a unit that is equal to 1/100th of 1%.
Investment grade/non-investment grade (high yield) categories and credit ratings breakdowns are based on ratings from S&P, which is a private independent rating service that assigns grades to bonds to represent their credit quality. The issues are evaluated based on such factors as the bond issuer’s financial strength and its ability to pay a bond’s principal and interest in a timely fashion. S&P’s ratings are expressed as letters ranging from ‘AAA’, which is the highest grade, to ‘D’, which is the lowest grade. A rating of BBB- or higher is considered investment grade and a rating below BBB- is considered non-investment grade. Other credit ratings agencies include Moody’s and Fitch, each of whom may have different ratings systems and methodologies.
Leverage ratio is a financial metric that helps investors assess how indebted a company is. A lower number is more desirable than a higher number. There are several ways to compute leverage, but one common approach is to divide the company’s total outstanding debt by its trailing 12-month profits.
Free cash flow represents the cash that a company is able to generate after laying out the money required to maintain and expand the company’s asset base. Free cash flow is important because it allows a company to pursue opportunities that enhance shareholder value.
A leveraged buyout (LBO) is the acquisition of another company using a significant amount of borrowed money (bonds or loans) to meet the cost of acquisition. The assets of the company being acquired are often used as collateral for the loans, along with the assets of the acquiring company.
The Sharpe ratio is the difference between the annualized portfolio return and the annualized risk-free return, divided by the annualized standard deviation of the portfolio returns. It represents the additional amount of return that an investor receives per unit of increase in risk.
Standard deviation (annualized): This measure of dispersion represents the degree to which an investment’s returns vary around a mean. The greater the standard deviation, the more volatile an investment’s returns were during the period measured.
Osterweis Capital Management is the adviser to the Osterweis Funds, which are distributed by Quasar Distributors, LLC. [OCMI-619020-2024-10-09]
