As the saying goes, a rising tide lifts all boats – when the economy is strong, stocks tend to perform well. Nonetheless, in both good times and bad, there is dispersion among equity returns, affirming the (obvious) truth that the health of the economy is only one of multiple factors influencing stock performance.
In our view, the most important driver of equity returns, particularly for emerging companies, is the growth rate of demand for their products and services. We believe that the best opportunities for market outperformance occur when a company is operating in a sector or industry that is undergoing a transformation, creating a growing wave of new customers. In our portfolio, we seek to invest in a select group of innovative companies that are able to capitalize on untapped, expanding markets.
Cyclical vs. Secular Growth
Broadly speaking, growth falls into two categories – cyclical and secular. Cyclical growth can be thought of as passive, whereas secular growth is driven by a structural change in a sector or industry.
Cyclical Growth
Cyclical growth, as the name implies, is highly correlated with the economic cycle. Industries that are driven by cyclical growth tend to deliver positive returns during expanding economies and do poorly during a downturn.
Automobiles are a great example. As you can see from the chart below, total vehicle sales plummeted during the Great Recession in 2008 and began recovering along with the general economy shortly thereafter. Not surprisingly, they also fell sharply during the depths of the pandemic in 2020.
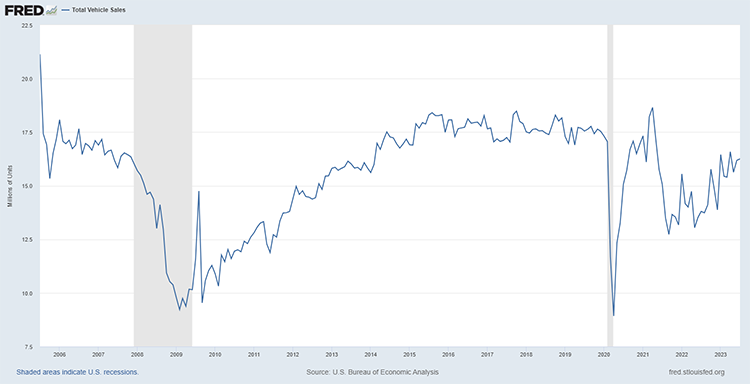
Source: Federal Reserve Bank of St. Louis
Secular Growth
Secular growth occurs when something fundamentally changes within a sector or industry, creating a wave of new demand. Secular growth rates can be materially higher than cyclical growth rates, as secular growth depends on changes in customer behavior rather than changes to GDP.
One of the great secular growth stories of the 21st century has been the rise in e-commerce. Online sales have been taking progressively more market share from traditional retailers for the past 20 years, a secular trend that has literally transformed how people shop. Even during the Great Recession, online shopping continued to expand, and interestingly, it substantially accelerated during the pandemic. Consumers were literally forced to stay home, which meant online shopping became a necessity. As society re-opened, in-person shopping regained some market share, but the long-term impact of e-commerce has been unmistakable.
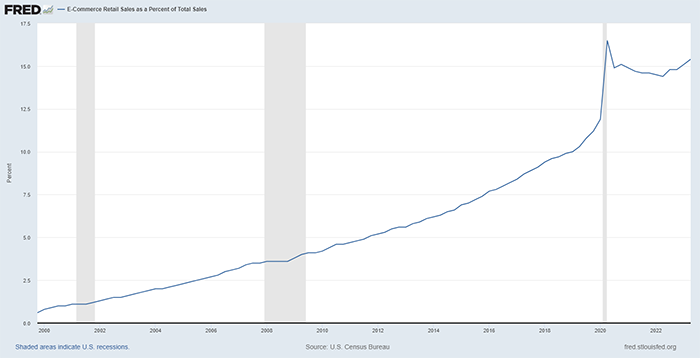
Source: Federal Reserve Bank of St. Louis
It is important to note that some secular trends are not as resilient as e-commerce. In fact, according to Morgan Stanley, only about 30% of growth companies are likely to repeat their success in back-to-back bull markets.1 In other words, more than two-thirds of secular growth trends slow down materially following a bear market, as the underlying demand drivers often change.
Types of Secular Growth
Secular growth can take many forms, and trends can differ across industries, but at the highest level we feel there are three primary types: (1) foundational technology; (2) replacement product, existing market; (3) new product, new market. And of course, individual companies sometimes fit into multiple categories.
Foundational Technology
Some technological innovations are so impactful that they not only generate their own wave of demand, but they also create a foundation upon which other businesses can grow. Importantly, companies at the epicenter of a foundational secular trend do not necessarily perform better or become larger than the firms that they eventually spawn.
The advent of the internet is a great example. Plenty of companies profited from the development of the internet infrastructure, but over time the biggest winners have been firms that successfully leveraged the technology, including Amazon, Google, Facebook, and Netflix.
Smartphones are another example, as the iOS and Android operating systems created an interconnected network of portable devices for businesses to exploit. Obviously, handset manufacturers like Apple and Samsung benefitted from the smartphone revolution, but so did companies like Uber and Lyft (among many others).
And more recently, the rise of cloud computing has created a new foundation upon which many other businesses are emerging. It is among the most significant secular changes happening today, as software users around the world are beginning to appreciate the benefits of cloud deployments (faster implementation, automatic upgrades) versus the hassles of local installations. Software vendors like the shift also, as it allows them to move to a subscription business model, which creates smoother, more predictable revenue streams. Both cloud providers (e.g., Amazon Web Services and Microsoft Azure) as well as cloud-native software firms (e.g., Salesforce.com and Adobe) have benefitted tremendously from this secular trend.
Replacement Product, Existing Market
Another major catalyst for secular growth occurs when an innovative startup builds a “better mousetrap,” taking market share from established incumbents. The key element to this type of growth is that the new company already knows that a viable market exists for its products/services. If they can truly deliver a superior solution, customers happily migrate, which results in outsized growth.
Amazon is an excellent example. As discussed above, online shopping has been taking market share from traditional retailers since it was introduced, and Amazon has been both the primary beneficiary as well as a major catalyst for the transition. The company has been able to expand continuously by capitalizing on consumer’s desire for convenience, and by creating a digital marketplace that obviated the need for in-person shopping. Features such as close-up photos, detailed product specifications, and crowdsourced reviews help Amazon customers feel comfortable purchasing items that they have never seen in person.
New Product, New Market
The third major type of secular growth occurs when an innovative startup develops a new product/service for a new market. In this case, the new offering must address a growing problem that has been previously unsolved, creating naturally strong demand.
Google fits into this category nicely. Prior to the advent of the internet, there was no need for search engines. But once the web was born, search became indispensable, as people needed a tool to navigate the ever-expanding landscape. Initially there were multiple competitors in the space, but over time Google established its dominance, currently controlling over 92% of all search traffic globally. The chart below shows the steady increase in Google searches from 2009-2019.
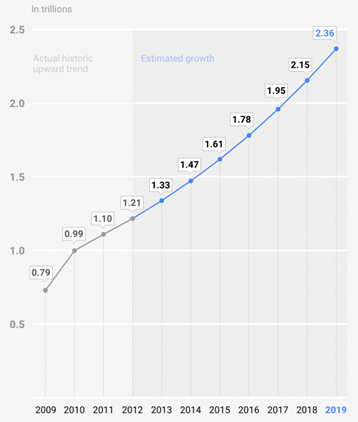
Source: Internet Live Stats
It is worth noting that Google also fits into the previous category (replacement product, existing market), as the site has effectively replaced traditional reference materials such as atlases, almanacs, and encyclopedias. But in our view, the specific category of secular growth is less important to the investment decision than the magnitude and staying power of the underlying trend(s).
Secular Growth in Practice
As emerging growth managers, we are constantly searching for companies that are well-positioned to take advantage of an untapped secular trend and deliver above market returns. The chart below provides a visual representation of our objective – to invest in companies just as they enter a period of sustained revenue acceleration.

Below we have listed three companies from our portfolio that we feel have identified important secular growth trends and that we expect to deliver attractive returns over the near to medium term.
Onto Innovation (ONTO)
Onto Innovation, which manufactures semiconductor capital equipment, is a classic case of a company building new products for a new market. The company is well-positioned to capitalize on the long-term growth of artificial intelligence (among other technology trends), which we believe is an extremely important foundational technology. Though currently in a cyclical downturn, the wafer fab equipment (WFE) market has grown at 20% annually since 2019. Onto has expanded even faster, growing at 25% annually, by operating in favorable niches and expanding to grow market share at key customers.
The company’s big secular driver is the growth of data stored in the cloud, which AI algorithms use to train their models. Data storage is projected to grow 6x from 100 zettabytes today to 600 by 2030. We particularly like ONTO’s exposure to packaging inspection, a growing market due to new chiplet architectures which call for more intensive inspection. The company reported $1 billion in revenue in 2022 and recently raised its target to $2 billion in revenue in 5 years. Also, semiconductor capital equipment companies are increasingly viewed as long-term beneficiaries of AI due to the need for bigger and more complex chips.
Insulet (PODD)
Insulet is a medical device company that manufactures insulin pumps. Their core technology is a great example of a replacement product for an existing market. Insulin was invented over 100 years ago, and for most of that time diabetics have had to monitor their blood sugar levels manually and then inject themselves with the correct dosage whenever necessary. Insulet has fundamentally changed the process for patients, effectively automating all the steps through a disposable insulin pump that is attached to the skin and wirelessly connected to a smartphone. The pump is also connected to a continuous glucose monitor, so it knows when (and how much) to dispense, and all the activity is managed through the smartphone app.
Not surprisingly, it has become quite popular. Today, around 40% of type 1 diabetics are on insulin pumps and Insulet has 24% market share. Additionally, they are capturing roughly 50% of new pumpers (diabetics who are switching to pumps on an annual basis), suggesting their market share will increase substantially over time. In the most recent quarter their U.S. pump business grew over 40%.
Axon (AXON)
Axon is a platform company with a strong presence in law enforcement and growing network effects. It is a business that does not fit neatly into a single secular growth category, as some of their products are replacements for equipment that already exists, while others are brand new. Regardless, widespread structural change in law enforcement has created robust demand for their technology.
The company has a mission-oriented culture with a track record of innovation. Axon dominates the non-lethal weapon market with its Taser products and has built two additional franchises with body cameras and digital evidence management. These systems are increasingly tied together with increasing inter-operability and sharing of data. For example, Fleet 3 is an in-car video system that uses software and integrated automatic license plate recognition to save officers time and embed video into Axon’s digital evidence management solutions. Its most recent Taser 10 device increases the number of probes from 4 to 10, while almost doubling the range of prior weapons to 45 feet. The company has also successfully expanded its customer base from just municipalities to a broader set of federal, corrections, and private security, as well as international customers. Axon’s goal is to approximately double revenue from $1.2 billion in 2022 to $2 billion in 2025, while increasing EBITDA margins from 20% to 25%.
Final Thoughts
In our view, identifying secular growth trends is the key to generating sustainable above market equity returns. We are constantly monitoring the market for new developments, and our focus on small cap companies allows us to invest in what we believe are the best ideas while they still offer the greatest upside potential.
1 - Dennis Sherva, Morgan Stanley, “Investing in Emerging Growth Stocks,” April, 1987
This piece was originally published on June 5, 2019.
James Callinan, CFA
Co-CIO – Small Cap Growth & Portfolio Manager
Featuring


James Callinan, CFA
Co-CIO – Small Cap Growth & Portfolio Manager
Jim Callinan, a partner at Osterweis, is a Portfolio Manager for the small cap growth strategy. Throughout his career he has focused on investing in companies that are early in their growth cycles. This experience has been the foundation of our high conviction, valuation-aware approach to investing in small cap growth companies.
Prior to Osterweis, Jim was the Co-Founder & Chief Investment Officer at RS Investments. He also founded the RS Growth Group LLC in 1996 and managed the RS Emerging Growth Fund from 1996 until 2010. In 1999 Jim was named Morningstar’s Domestic Stock Manager of the Year.*
Jim served as portfolio manager for the Putnam OTC Emerging Growth Fund from 1994 to 1996 and began his career at Putnam Investments as an equity research analyst in 1987. He joined Osterweis in 2016 and brought with him the Emerging Growth Partners, LP, a concentrated small cap growth strategy he founded at RS in 2006.
Jim graduated from Harvard College with a B.A. in Economics, New York University with an M.S. in Accounting, and Harvard Business School with an M.B.A. He holds the CFA designation and is a member of the Weatherbie Capital Advisory Board. Outside of work, Jim enjoys spending time with his family, travelling, and golfing.
*Morningstar Managers of the Year are determined by a combination of qualitative research by Morningstar’s manager research analysts; risk-adjusted medium- to long-term performance track records; and performance in the calendar year.
For more information about this strategy, please send us an email or call us at (800) 700-3316.
Opportunity Fund Quarter-End Performance (as of 6/30/26)
| Fund | 1 MO | QTD | YTD | 1 YR | 3 YR | 5 YR | 10 YR |
INCEP (10/1/2012) |
|---|---|---|---|---|---|---|---|---|
| OSTGX | 12.44% | 35.34% | 30.22% | 41.37% | 18.23% | 5.05% | 16.63% | 15.05% |
| Russell 2000 Growth Index | 3.55% | 25.71% | 22.18% | 38.74% | 18.44% | 5.57% | 11.97% | 11.67% |
Gross/Net expense ratio as of 3/31/26: 1.22% / 1.12%. The Adviser has contractually agreed to waive certain fees through June 30, 2027. The net expense ratio is applicable to investors.
Performance data quoted represent past performance; past performance does not guarantee future results. The investment return and principal value of an investment will fluctuate so that an investor’s shares, when redeemed, may be worth more or less than their original cost. Current performance of the Fund may be higher or lower than the performance quoted. Performance data current to the most recent month end may be obtained by calling shareholder services toll free at (866) 236-0050. Performance prior to December 1, 2016 is that of another investment vehicle (the “Predecessor Fund”) before the commencement of the Fund’s operations. The Predecessor Fund was converted into the Fund on November 30, 2016. The Predecessor Fund’s performance shown includes the deduction of the Predecessor Fund’s actual operating expenses. In addition, the Predecessor Fund’s performance shown has been recalculated using the management fee that applies to the Fund, which has the effect of reducing the Predecessor Fund’s performance. The Predecessor Fund was not a registered mutual fund and so was not subject to the same operating expenses or investment and tax restrictions as the Fund. If it had been, the Predecessor Fund’s performance may have been lower.
Rates of return for periods greater than one year are annualized.
Where applicable, charts illustrating the performance of a hypothetical $10,000 investment made at a Fund’s inception assume the reinvestment of dividends and capital gains, but do not reflect the effect of any applicable sales charge or redemption fees. Such charts do not imply any future performance.
The Russell 2000 Growth Index (Russell 2000G) is a market-capitalization-weighted index representing the small cap growth segment of U.S. equities. This index does not incur expenses and is not available for investment. This index includes reinvestment of dividends and/or interest.
References to specific companies, market sectors, or investment themes herein do not constitute recommendations to buy or sell any particular securities.
There can be no assurance that any specific security, strategy, or product referenced directly or indirectly in this commentary will be profitable in the future or suitable for your financial circumstances. Due to various factors, including changes to market conditions and/or applicable laws, this content may no longer reflect our current advice or opinion. You should not assume any discussion or information contained herein serves as the receipt of, or as a substitute for, personalized investment advice from Osterweis Capital Management.
Complete holdings of all Osterweis mutual funds (“Funds”) are generally available ten business days following quarter end. Holdings and sector allocations may change at any time due to ongoing portfolio management. Fund holdings as of the most recent quarter end are available here: Opportunity Fund
Opinions expressed are those of the author, are subject to change at any time, are not guaranteed and should not be considered investment advice.
EBITDA is an acronym for Earnings Before Interest, Taxes, Depreciation and Amortization.
As of 6/30/2023, the Osterweis Emerging Opportunity Fund did not own Amazon, Google, Facebook, and Netflix.
Mutual fund investing involves risk. Principal loss is possible. The Osterweis Opportunity Fund may invest in unseasoned companies, which involve additional risks such as abrupt or erratic price movements. The Fund may invest in small and mid-sized companies, which may involve greater volatility than large-sized companies. The Fund may invest in IPOs and unseasoned companies that are in the early stages of their development and may pose more risk compared to more established companies. Higher turnover rates may result in increased transaction costs, which could impact performance. From time to time, the Fund may have concentrated positions in one or more sectors subjecting the Fund to sector emphasis risk. The Fund may invest in foreign and emerging market securities, which involve greater volatility and political, economic and currency risks and differences in accounting methods. These risks may increase for emerging markets.
The Osterweis Funds are available by prospectus only. The Funds’ investment objectives, risks, charges, and expenses must be considered carefully before investing. The summary and statutory prospectuses contain this and other important information about the Funds. You may obtain a summary or statutory prospectus by calling toll free at (866) 236-0050, or by visiting www.osterweis.com/statpro. Please read the prospectus carefully before investing to ensure the Fund is appropriate for your goals and risk tolerance.
Osterweis Capital Management is the adviser to the Osterweis Funds, which are distributed by Quasar Distributors, LLC. [OSTE-20230908-0968]
