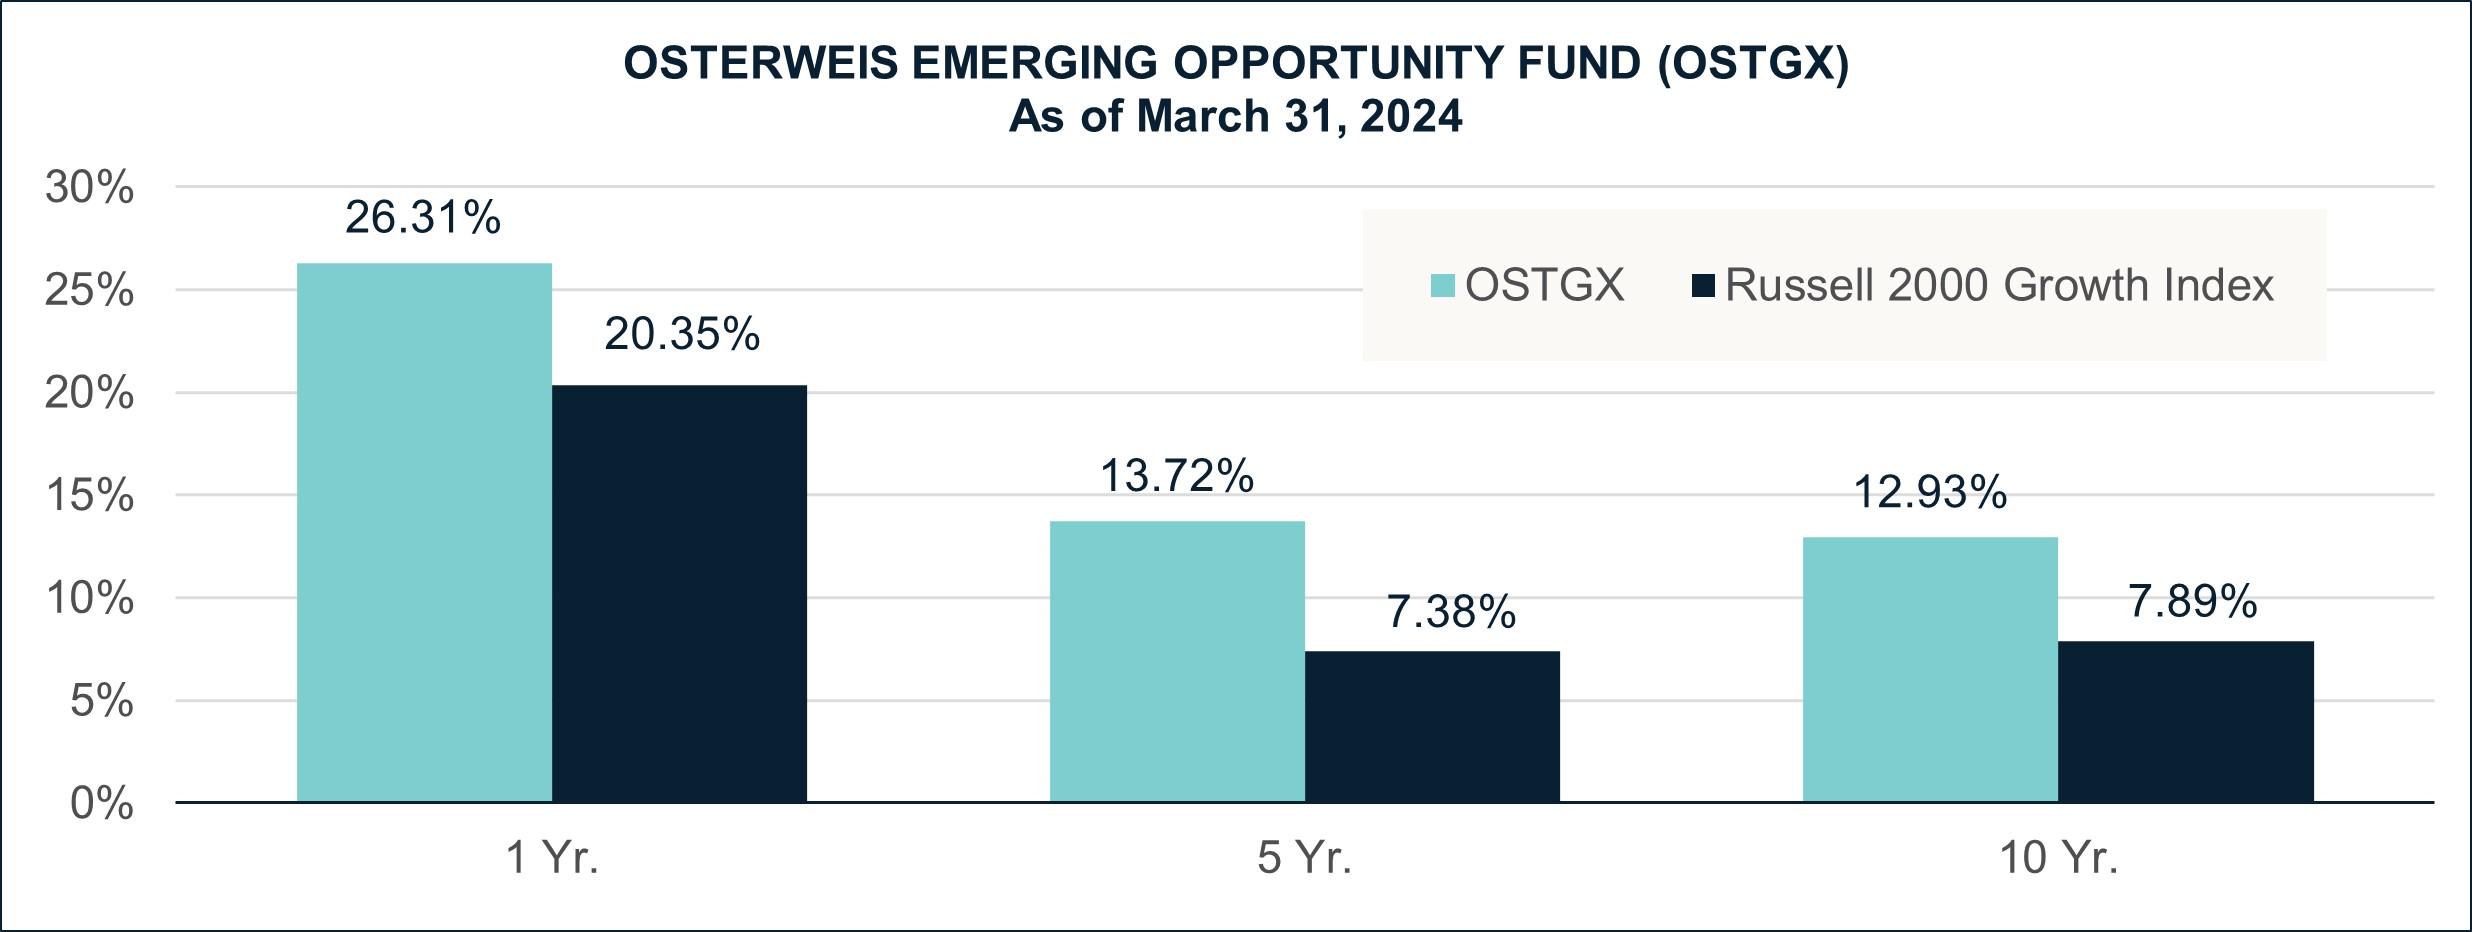
Gross/Net expense ratio as of 3/31/2023: 1.25%/1.13%. The Adviser has contractually agreed to waive certain fees through June 30, 2024. The net expense ratio is applicable to investors.
Performance data quoted represent past performance; past performance does not guarantee future results. The investment return and principal value of an investment will fluctuate so that an investor’s shares, when redeemed, may be worth more or less than their original cost. Current performance of the Fund may be higher or lower than the performance quoted. Performance data current to the most recent month end may be obtained by calling shareholder services toll free at (866) 236-0050. See additional disclosures at the end of the piece.
Inefficiencies in Small Cap Growth = Opportunity
Active managers focus on identifying stocks that have underappreciated growth prospects relative to their current price. Because markets are not perfectly efficient, mispricing can occur when there is a fundamental misunderstanding about a company. The small cap market is especially prone to mispricing.
An Emerging Landscape
Many smaller companies operate in rapidly evolving markets that are giving rise to new industries or market segments. Additionally, these companies may have relatively short track records as public companies, creating skepticism about their growth trajectories. Think about Amazon in its early days when people did not understand how book sales and broader retail categories could be revolutionized online, displacing individual stores by centralizing warehousing and distribution. This type of ambiguity creates an opportunity to use in-depth research to identify the small subset of companies that are positioned to succeed over time.
Limited Analyst Coverage
Additionally, the small cap market lacks in-depth analyst coverage. Analysts tend to focus their attention on larger companies, which are more widely known and have a larger impact on the market, as illustrated in the chart below.
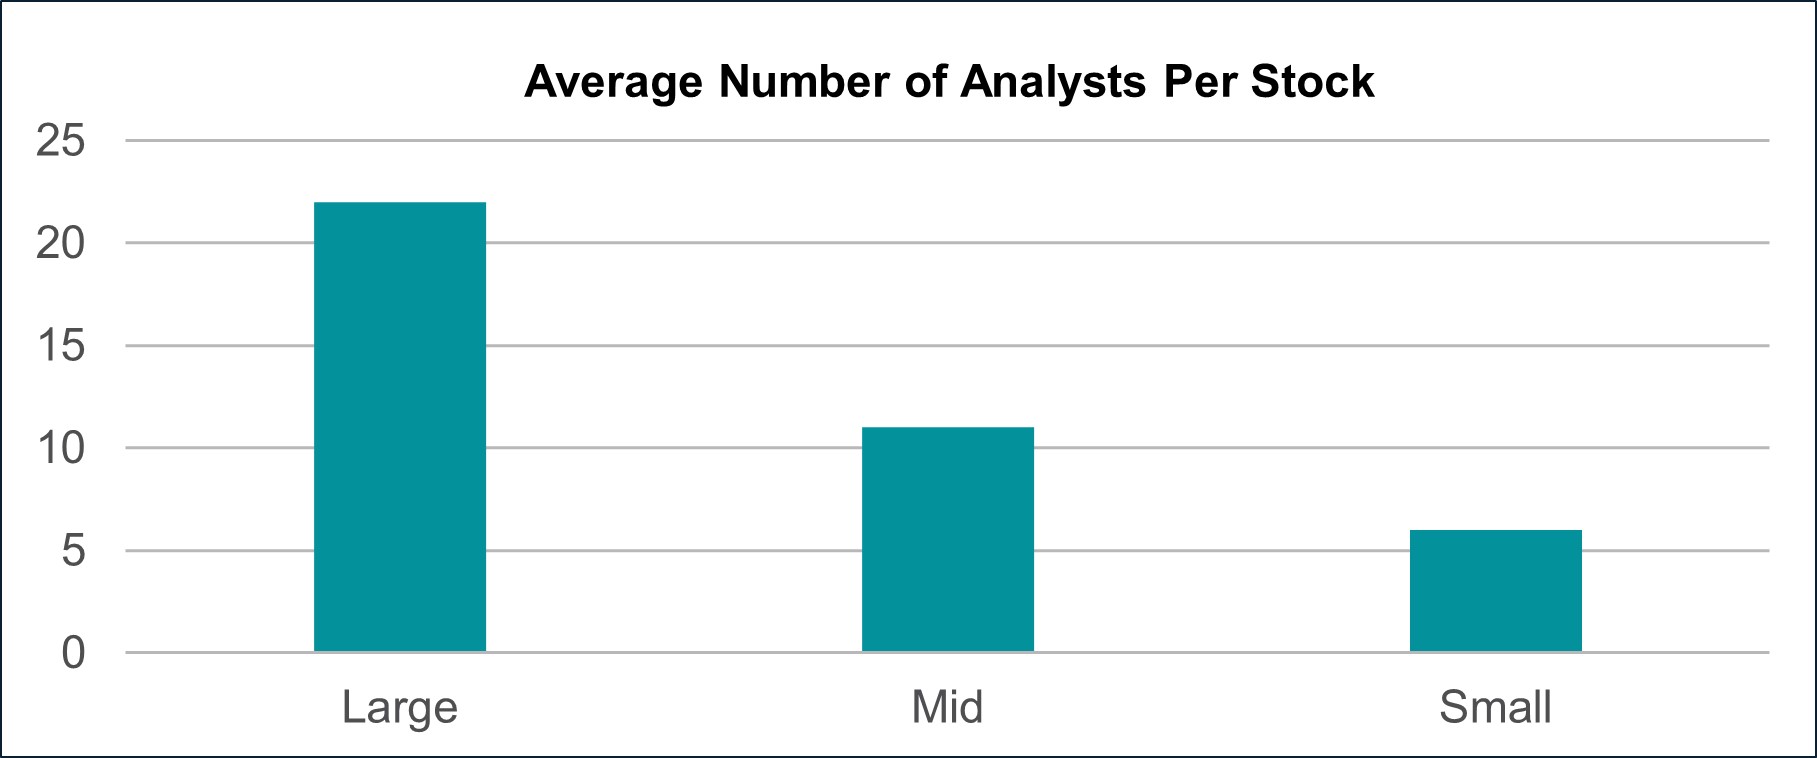
Source: FactSet. Data as of June 2023. Large, mid, and small cap indexes are S&P 500, S&P MidCap 400, and S&P SmallCap 600, respectively.
When you couple the market inefficiencies created by both the potential mystery around smaller companies and lower analyst coverage, experienced investors can add value through disciplined fundamental research. In his book, Pioneering Portfolio Management, former Yale University Chief Investment Officer David Swensen wrote:
Because Wall Street finds following smaller companies far less profitable, in terms of both day-to-day trading opportunities and occasional investment banking transactions, investors face the prospect of uncovering some interesting, mispriced investment opportunities. Although success demands hard work, small capitalization equity managers with an edge have a reasonable shot at generating attractive relative returns.
Successfully Navigating the Small Cap Growth Market
Not all small cap companies will be able to grow and create shareholder value. It is critical to deploy a disciplined approach to identify those companies that can deliver sustainable growth over a multi-year horizon. Looking at the iShares Russell 2000 Growth ETF, nearly 13% of companies are unprofitable based on 2024 projected EBITDA. Additionally, the fourth quarter 2023 revenue growth rate for the median company was 7.4%. A passive approach can leave investors unnecessarily exposed to unprofitable and lower-growth companies.
We have found that focusing on a high-conviction portfolio of carefully selected businesses has allowed us to deliver strong results over time. Companies in our portfolio must meet our standard of quality, growth, and valuation.
Quality
Because the small cap market includes many unproven and unprofitable companies, it is critical to focus on quality businesses. We define “quality” as companies with the following four characteristics: (1) a distinct proprietary advantage; (2) a leading position in the industry; (3) potential for margin expansion; and (4) the presence of a strong management team.
Through our in-depth fundamental research, we identify a select group of quality companies and generally avoid unprofitable and/or highly levered businesses. Our San Francisco location gives us the opportunity to perform ground-floor research with many of our portfolio companies and their competitors, as well as meet with management teams frequently.

Source: FactSet. The above are based on 2024 projected financials. To be conservative, ETF companies for which data is not available are assumed to be profitable. Companies for which data is not available are excluded from the Median Company Profit Margin.
Secular Growth
We are also committed to finding companies that are experiencing durable secular growth, as opposed to cyclical businesses that are simply benefitting from a strengthening economy. In other words, we are looking for companies that operate in a sector or industry that is undergoing a structural transformation, as this generally translates into an expanding customer base as well as pricing power. Historically, we have found that secular growth drives sustainable increases in both customer demand and revenue growth.
Moreover, secular growth usually marks a permanent shift in purchasing patterns. Sometimes it is because an older, inferior product is replaced by a better one (e.g., flip phones -> smart phones), and sometimes it is because something entirely new comes along (e.g., cloud computing, artificial intelligence). We focus on smaller companies with the innovative DNA to deliver superior value to customers. By contrast, incumbents, which are frequently larger companies, can get caught off-guard. As Alphabet’s CEO recently admitted, “scale isn’t always good for you since it makes it harder to “move fast [and] maintain a culture of risk-taking.” He added that “counter-intuitively … the more successful things are, the more risk-averse people become.”
Our portfolio is built around companies that can deliver durable increases in demand, so it has maintained much higher revenue growth than the index.
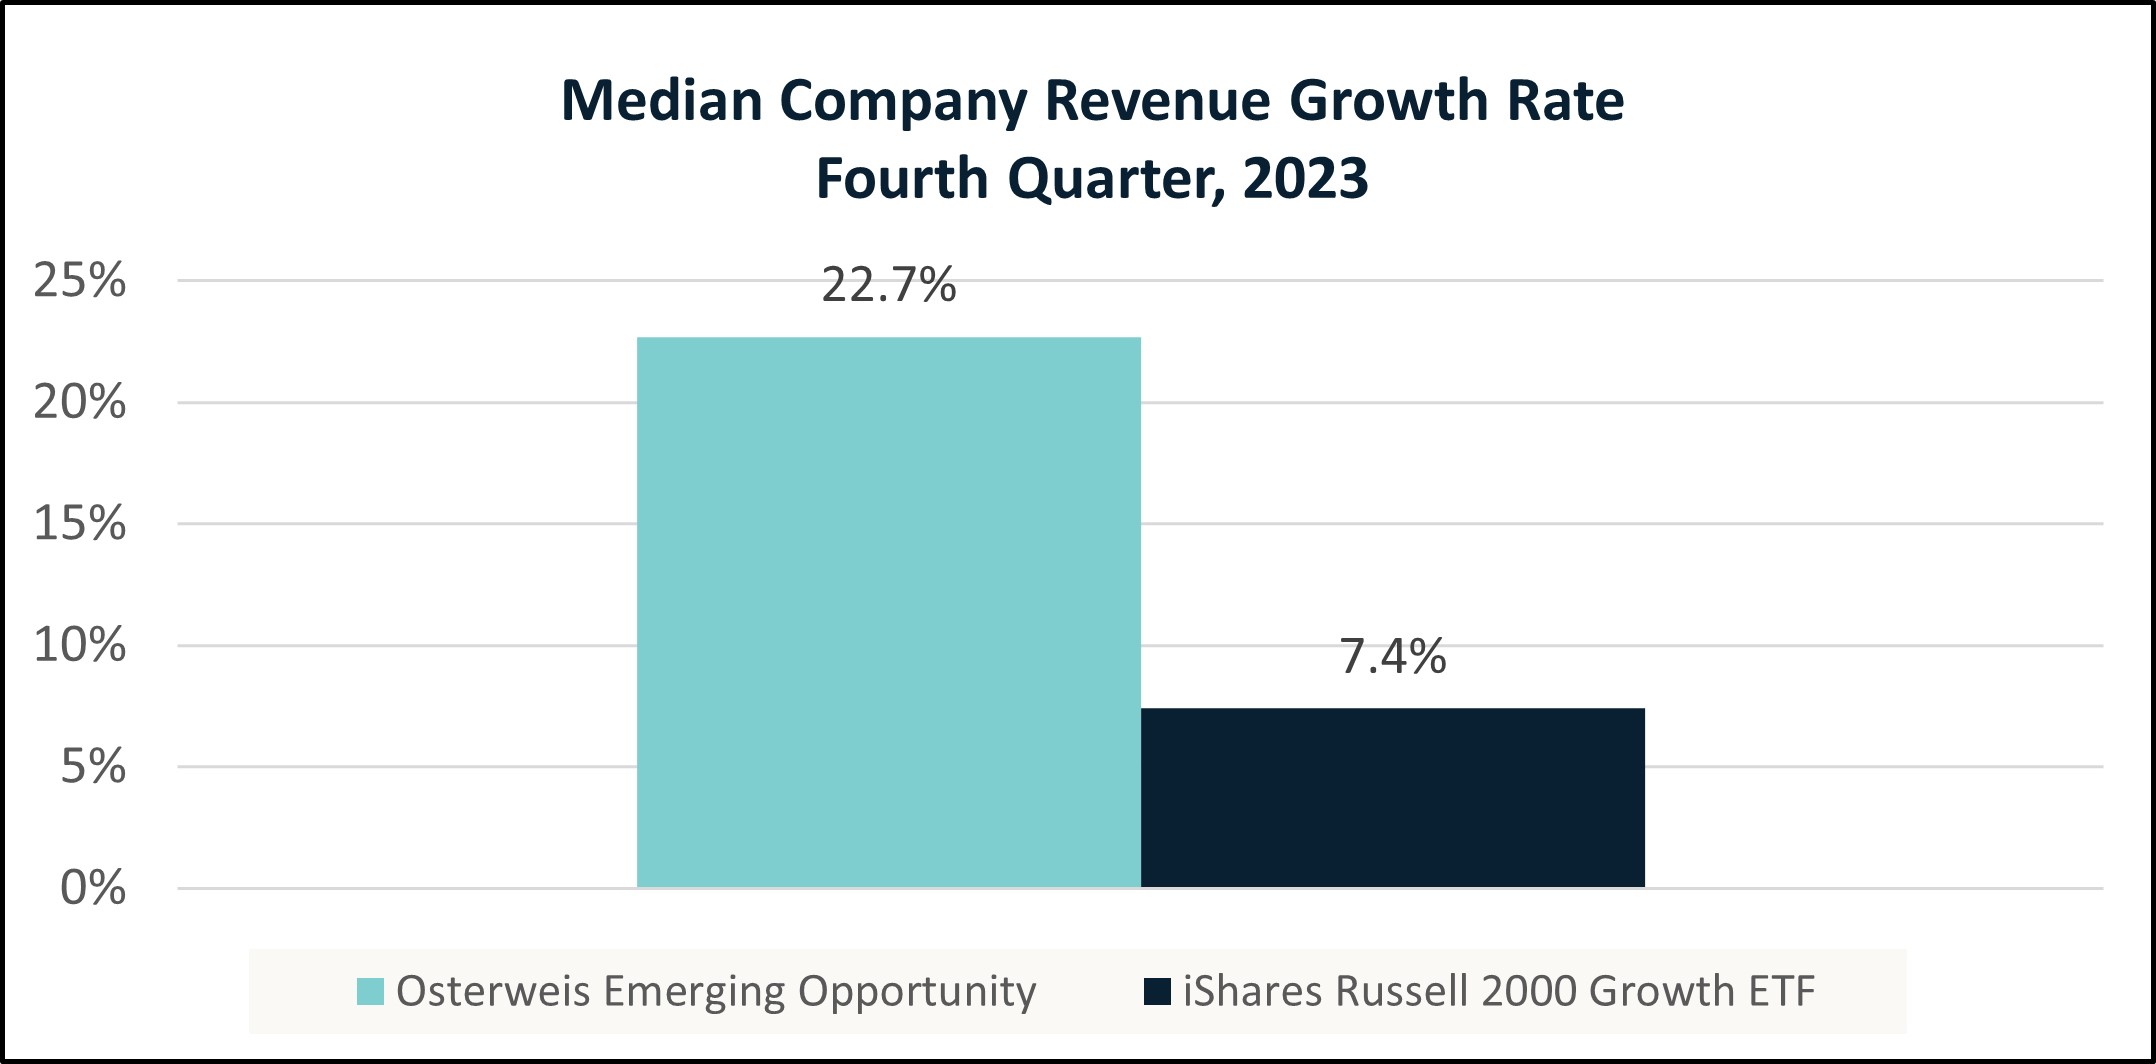
Source: FactSet. The figures above exclude companies where data was not available.
Valuation
Buying at the right time is nearly as important as buying the right companies. Because of their distinctive growth/quality characteristics, the companies in our portfolio tend to trade at premiums compared to many names in the index, which have lower growth and/or profits. We are patient investors that wait for appropriate entry points. In selecting investments, we utilize an absolute valuation discipline – each new position must have 100% upside potential based on our five-year earnings model using an industry appropriate P/E ratio of no more than 30x, and we generally trim when the upside falls to 50% or lower.
Final Thoughts
Identifying and exploiting mispricing opportunities is always challenging, but it is less so in an inefficient market like small cap growth, which contains many relatively unknown companies. This allows us to conduct our own due diligence and formulate a differentiated view, which can lead to substantial upside.
Using a combination of quality, growth, and valuation, we have established a repeatable method of finding these opportunities to drive long-term returns. This disciplined approach has led to outperformance versus the Russell 2000 Growth since the inception of the fund.
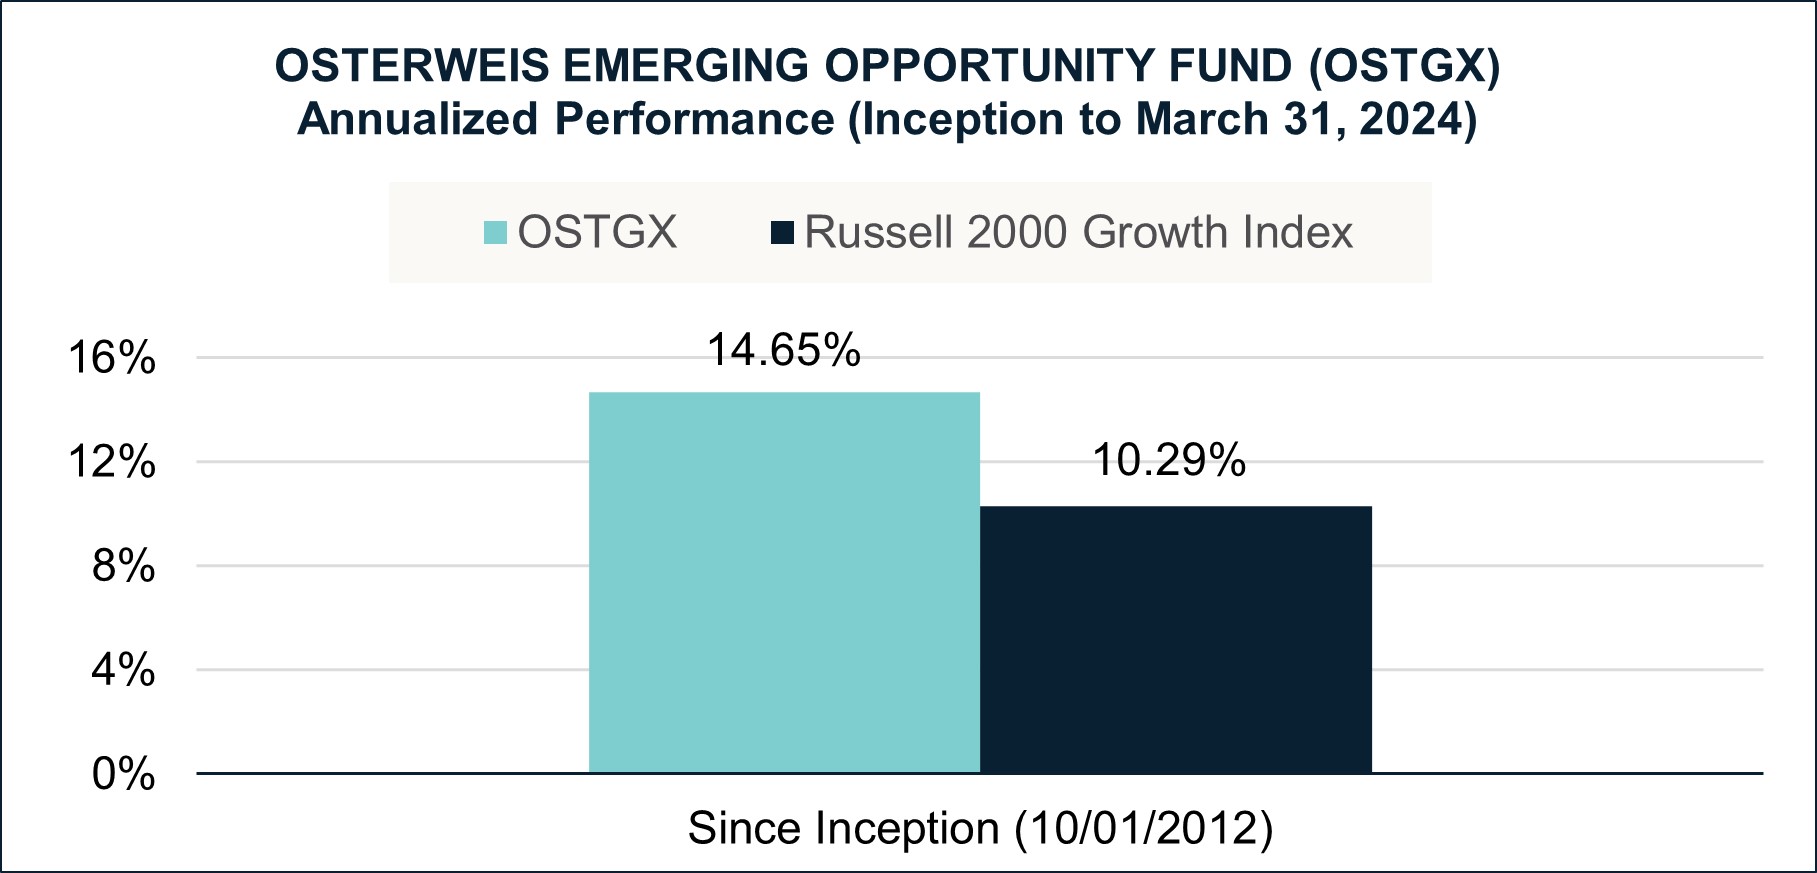
Performance data quoted represent past performance; past performance does not guarantee future results. See additional disclosures at the beginning and end of the piece.
Bryan Wong, CFA
Co-CIO – Small Cap Growth & Co-Lead Portfolio Manager
Featuring

Bryan Wong, CFA
Co-CIO – Small Cap Growth & Co-Lead Portfolio Manager
Bryan Wong, a partner at Osterweis, is a Co-Lead Portfolio Manager for the small cap growth strategy. He is passionate about identifying overlooked opportunities with the potential to deliver strong, sustainable performance, helping clients achieve their long-term investment objectives. Bryan particularly enjoys investing in small companies, where the dynamic nature of the market provides fundamental investors the ability to gain a distinct edge through rigorous research and analysis.
Prior to joining Osterweis Capital Management in 2014, Bryan was a member of the investment team managing the endowment of the David and Lucile Packard Foundation. Before that, he was an Analyst at Wohl Capital Management, a long/short hedge fund.
Bryan graduated from Yale University with a B.A. in Political Science and International Studies with distinction and from the University of California Berkeley, Haas School of Business, with an M.B.A., where he was an Investment Management Fellow. He holds the CFA designation and is a member of the CFA Society of San Francisco. Bryan also serves on the investment committee of the Asian Pacific Fund. Outside of work, he enjoys spending time with family and swimming.
For more information about this strategy, please send us an email or call us at (800) 700-3316.
Performance data quoted represent past performance; past performance does not guarantee future results. The investment return and principal value of an investment will fluctuate so that an investor’s shares, when redeemed, may be worth more or less than their original cost. Current performance of the Fund may be higher or lower than the performance quoted. Performance data current to the most recent month end may be obtained by calling shareholder services toll free at (866) 236-0050. Performance prior to December 1, 2016 is that of another investment vehicle (the “Predecessor Fund”) before the commencement of the Fund’s operations. The Predecessor Fund was converted into the Fund on November 30, 2016. The Predecessor Fund’s performance shown includes the deduction of the Predecessor Fund’s actual operating expenses. In addition, the Predecessor Fund’s performance shown has been recalculated using the management fee that applies to the Fund, which has the effect of reducing the Predecessor Fund’s performance. The Predecessor Fund was not a registered mutual fund and so was not subject to the same operating expenses or investment and tax restrictions as the Fund. If it had been, the Predecessor Fund’s performance may have been lower.
The Russell 2000 Growth Index (Russell 2000G) is a market-capitalization-weighted index representing the small cap growth segment of U.S. equities.
The Fund’s portfolio has been compared to the iShares Russell 2000 Growth ETF as we believe it is representative of the Russell 2000 Growth index on an aggregate basis and it is one of the largest ETFs for the Russell 2000 Growth Index. The iShares Russell 2000 Growth ETF seeks to track the investment results of an index composed of small-capitalization U.S. equities that exhibit growth characteristics whereas OSTGX seeks long-term capital appreciation by primarily investing in companies that the Osterweis Capital Management investment team believes are likely to experience strong revenue growth and rising profitability. Investing in the ETF involves the risk of investing in small cap companies that may be less stable and more volatile. The expense ratio for the ETF 0.23% as of August 1, 2023. An ETF, or exchange-traded fund, is a marketable security that tracks an index, a commodity, bonds, or a basket of assets like an index fund. Unlike mutual funds, an ETF trades like a common stock on a stock exchange. ETFs are generally passively managed and track an index while mutual funds may be actively managed and have various investment objectives. ETFs may have lower fees than mutual funds. ETFs may be traded by investors throughout the day while mutual funds are only traded once per day. ETFs maybe be more tax efficient than mutual funds.
References to specific ETFs, companies, market sectors, or investment themes herein do not constitute recommendations to buy or sell any particular securities.
Price-to-Earnings (P/E) Ratio is the ratio of a company’s stock price to its 12 months’ earnings per share.
EBITDA is an acronym for Earnings Before Interest, Taxes, Depreciation, and Amortization.
This commentary contains the current opinions of the authors as of the date above, which are subject to change at any time, are not guaranteed, and should not be considered investment advice. This commentary has been distributed for informational purposes only and is not a recommendation or offer of any particular security, strategy, or investment product. Information contained herein has been obtained from sources believed to be reliable but is not guaranteed.
Mutual fund investing involves risk. Principal loss is possible. The Osterweis Opportunity Fund may invest in unseasoned companies, which involve additional risks such as abrupt or erratic price movements. The Fund may invest in small and mid-sized companies, which may involve greater volatility than large-sized companies. The Fund may invest in IPOs and unseasoned companies that are in the early stages of their development and may pose more risk compared to more established companies. The Fund may invest in ETFs, which involve risks that do not apply to conventional funds. Higher turnover rates may result in increased transaction costs, which could impact performance. From time to time, the Fund may have concentrated positions in one or more sectors subjecting the Fund to sector emphasis risk. The Fund may invest in foreign and emerging market securities, which involve greater volatility and political, economic and currency risks and differences in accounting methods. These risks may increase for emerging markets.
The Osterweis Funds are available by prospectus only. The Funds’ investment objectives, risks, charges, and expenses must be considered carefully before investing. The summary and statutory prospectuses contain this and other important information about the Funds. You may obtain a summary or statutory prospectus by calling toll free at (866) 236-0050, or by visiting www.osterweis.com/statpro. Please read the prospectus carefully before investing to ensure the Fund is appropriate for your goals and risk tolerance.
Osterweis Capital Management is the adviser to the Osterweis Funds, which are distributed by Quasar Distributors, LLC. [OCMI-551148-2024-05-23]
