A Contrarian View: Now Is the Time to Invest in Growth
We have always believed that growth stocks belong in any long-term asset allocation. Our logic is simple – over time, companies with steadily increasing earnings should deliver higher returns than slow growing companies.
Nonetheless, many investors avoid growth stocks, fearing they are little more than well-disguised momentum stocks. Those concerns are elevated right now, as the recent market selloff has investors worried the long-running economic expansion is finally slowing down, potentially causing growth stocks to fall faster than more defensive value stocks.
A recent report from Cornerstone Macro argues that the opposite is true. The authors agree with the concerns about a potential slowdown, but they believe that a cooling economy is actually quite favorable for growth firms. Moreover, the authors claim that the traditional risk relationship between growth and value is changing.
As the Market Cools, Earnings Take Priority
According to the Cornerstone report, “History shows that the sweet-spot for growth, cyclically speaking, is the period that follows a peak in economic prospects.” The chart below shows the three phases that typically occur after a peak in economic activity.
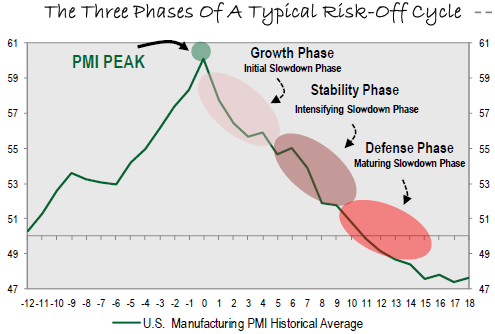
The x-axis shows the number of months before and after the economy hits its apex, as measured by the Institute for Supply Management’s Purchasing Manager’s Index (PMI). Citing a recent decline in the PMI following a multi-year peak, Cornerstone argues that the U.S. economy is at the beginning of a sustained period of slower growth. They believe PMI is a leading economic indicator signaling that the long-running expansion is likely to lose steam as the Fed pushes up rates and inflationary pressures mount.
They argue that a slowdown favors growth firms because it is a more challenging environment in which to operate, significantly reducing the number of companies that are able to deliver steadily increasing earnings. And historically, those that are able to do it are almost always growth firms, as they are less sensitive to the state of the macro economy. These companies should stand out from the crowd, which will increase demand for their shares and push up their stock price.
Cornerstone believes the process is already underway. Using the S&P 500 as a proxy for the broader market, they show that breadth (as measured by the number of stocks above their 150 day moving average) has declined since 2016 while the price of the index has steadily risen.
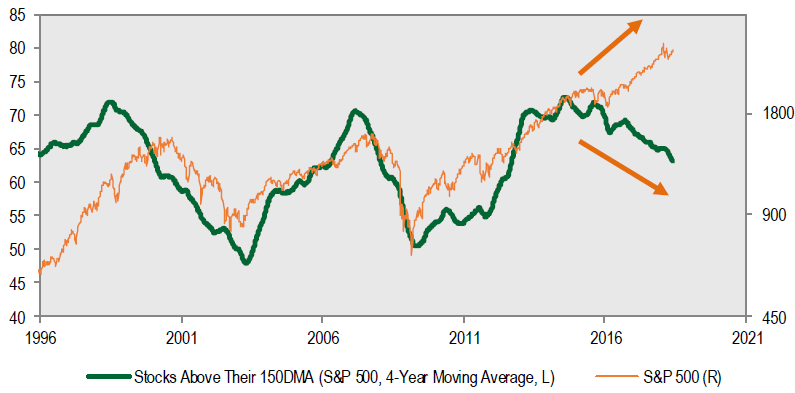
Their conclusion is that the gains are driven by a progressively smaller set of growth companies whose share prices are rallying disproportionately.
Structural Shifts Should Continue to Favor Growth
The authors also point out that growth has beaten value over the past decade*, and they argue that the key post-crisis structural shift that has driven this dynamic is likely to continue.
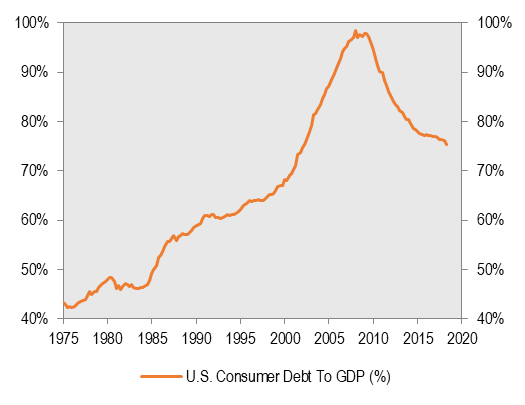
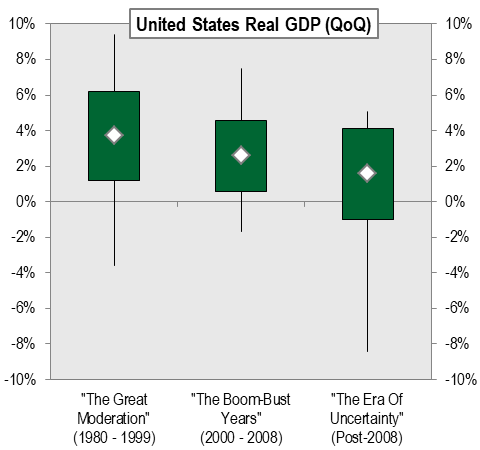
Specifically, consumer debt as a portion of GDP has fallen roughly 20% in the past decade, and the authors believe this is the major reason quarter-over-quarter GDP growth has been materially slower during the current recovery than during other expansionary periods. The present growth rate is roughly half the rate from 1980-1999, and roughly 75% of the growth rate from 2000-2008.
Reduced GDP growth has translated to slower top line expansion for the broader market, pushing investors toward growth companies. They expect this trend to intensify as the economy slows in the near-to-medium term.
Risk Profiles Are Changing
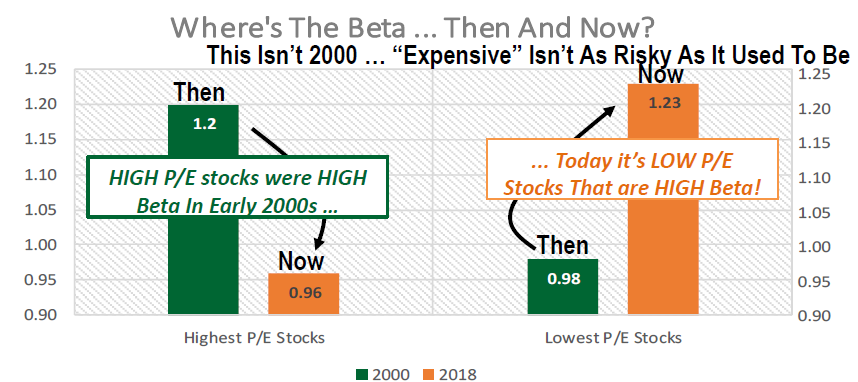
Perhaps the most intriguing component of Cornerstone’s research is their claim that the traditional risk relationship between growth and value has changed.
Using beta as a proxy for risk, the authors show that the relationship between P/E and beta has essentially reversed itself over the past 15 years. Specifically, high P/E stocks now have a low beta and vice-versa.
Conclusion
Cornerstone’s analysis offers an interesting perspective that combines conventional wisdom with a contrarian view. They agree with the prevailing sentiment that the current economic expansion is likely to slow down, but they have the uncommon belief that such a change would actually be good for growth stocks.

James Callinan, CFA
Chief Investment Officer – Small Cap Growth
Featuring


James Callinan, CFA
Chief Investment Officer – Small Cap Growth
Jim Callinan, a partner at Osterweis, is the Lead Portfolio Manager for the small cap growth strategy. Throughout his career he has focused on investing in companies that are early in their growth cycles. This experience has been the foundation of our high conviction, valuation-aware approach to investing in small cap growth companies.
Prior to Osterweis, Jim was the Co-Founder & Chief Investment Officer at RS Investments. He also founded the RS Growth Group LLC in 1996 and managed the RS Emerging Growth Fund from 1996 until 2010. In 1999 Jim was named Morningstar’s Domestic Stock Manager of the Year.*
Jim served as portfolio manager for the Putnam OTC Emerging Growth Fund from 1994 to 1996 and began his career at Putnam Investments as an equity research analyst in 1987. He joined Osterweis in 2016 and brought with him the Emerging Growth Partners, LP, a concentrated small cap growth strategy he founded at RS in 2006.
Jim graduated from Harvard College with a B.A. in Economics, New York University with an M.S. in Accounting, and Harvard Business School with an M.B.A. He holds the CFA designation and is a member of the Weatherbie Capital Advisory Board. Outside of work, Jim enjoys spending time with his family, travelling, and golfing.
*Morningstar Managers of the Year are determined by a combination of qualitative research by Morningstar’s manager research analysts; risk-adjusted medium- to long-term performance track records; and performance in the calendar year.
For more information about this strategy, please send us an email or call us at (800) 700-3316.
Opportunity Fund Quarter-End Performance (as of 6/30/25)
| Fund | 1 MO | QTD | YTD | 1 YR | 3 YR | 5 YR | 10 YR |
INCEP (10/1/2012) |
|---|---|---|---|---|---|---|---|---|
| OSTGX | 4.79% | 8.50% | -7.64% | -1.79% | 12.69% | 7.31% | 10.98% | 13.21% |
| Russell 2000 Growth Index | 5.89% | 11.97% | -0.48% | 9.73% | 12.38% | 7.42% | 7.14% | 9.78% |
Gross/Net expense ratio as of 3/31/25: 1.19% / 1.12%. The Adviser has contractually agreed to waive certain fees through June 30, 2026. The net expense ratio is applicable to investors.
Performance data quoted represent past performance; past performance does not guarantee future results. The investment return and principal value of an investment will fluctuate so that an investor’s shares, when redeemed, may be worth more or less than their original cost. Current performance of the Fund may be higher or lower than the performance quoted. Performance data current to the most recent month end may be obtained by calling shareholder services toll free at (866) 236-0050. Performance prior to December 1, 2016 is that of another investment vehicle (the “Predecessor Fund”) before the commencement of the Fund’s operations. The Predecessor Fund was converted into the Fund on November 30, 2016. The Predecessor Fund’s performance shown includes the deduction of the Predecessor Fund’s actual operating expenses. In addition, the Predecessor Fund’s performance shown has been recalculated using the management fee that applies to the Fund, which has the effect of reducing the Predecessor Fund’s performance. The Predecessor Fund was not a registered mutual fund and so was not subject to the same operating expenses or investment and tax restrictions as the Fund. If it had been, the Predecessor Fund’s performance may have been lower.
Rates of return for periods greater than one year are annualized.
Where applicable, charts illustrating the performance of a hypothetical $10,000 investment made at a Fund’s inception assume the reinvestment of dividends and capital gains, but do not reflect the effect of any applicable sales charge or redemption fees. Such charts do not imply any future performance.
The Russell 2000 Growth Index (Russell 2000G) is a market-capitalization-weighted index representing the small cap growth segment of U.S. equities. This index does not incur expenses, is not available for investment and includes the reinvestment of dividends.
References to specific companies, market sectors, or investment themes herein do not constitute recommendations to buy or sell any particular securities.
There can be no assurance that any specific security, strategy, or product referenced directly or indirectly in this commentary will be profitable in the future or suitable for your financial circumstances. Due to various factors, including changes to market conditions and/or applicable laws, this content may no longer reflect our current advice or opinion. You should not assume any discussion or information contained herein serves as the receipt of, or as a substitute for, personalized investment advice from Osterweis Capital Management.
Complete holdings of all Osterweis mutual funds (“Funds”) are generally available ten business days following quarter end. Holdings and sector allocations may change at any time due to ongoing portfolio management. Fund holdings as of the most recent quarter end are available here: Opportunity Fund
Opinions expressed are those of the author, are subject to change at any time, are not guaranteed and should not be considered investment advice.
The charts and graphs included in this article were all provided by Cornerstone Macro.
Mutual fund investing involves risk. Principal loss is possible. The Osterweis Opportunity Fund may invest in unseasoned companies, which involve additional risks such as abrupt or erratic price movements. The Fund may invest in small and mid-sized companies, which may involve greater volatility than large-sized companies. The Fund may invest in IPOs and unseasoned companies that are in the early stages of their development and may pose more risk compared to more established companies. The Fund may invest in ETFs, which involve risks that do not apply to conventional funds. Higher turnover rates may result in increased transaction costs, which could impact performance. From time to time, the Fund may have concentrated positions in one or more sectors subjecting the Fund to sector emphasis risk. The Fund may invest in foreign and emerging market securities, which involve greater volatility and political, economic and currency risks and differences in accounting methods. These risks may increase for emerging markets.
The ISM Manufacturing Index monitors employment, production, inventories, new orders and supplier deliveries. The Index is based on surveys of more than 300 manufacturing firms by the Institute for Supply Management (ISM).
Beta is a measure of the volatility, or systematic risk, of a security or a portfolio in comparison to the market as a whole.
{PE_ratio}
The S&P 500 Index is widely regarded as the standard for measuring large cap U.S. stock market performance. The index does not incur expenses, is not available for investment, and includes the reinvestment of dividends.
The Osterweis Funds are available by prospectus only. The Funds’ investment objectives, risks, charges, and expenses must be considered carefully before investing. The summary and statutory prospectuses contain this and other important information about the Funds. You may obtain a summary or statutory prospectus by calling toll free at (866) 236-0050, or by visiting www.osterweis.com/statpro. Please read the prospectus carefully before investing to ensure the Fund is appropriate for your goals and risk tolerance.
Osterweis Capital Management is the adviser to the Osterweis Funds, which are distributed by Quasar Distributors, LLC. [35754]
